EX-99.1
Published on September 8, 2025
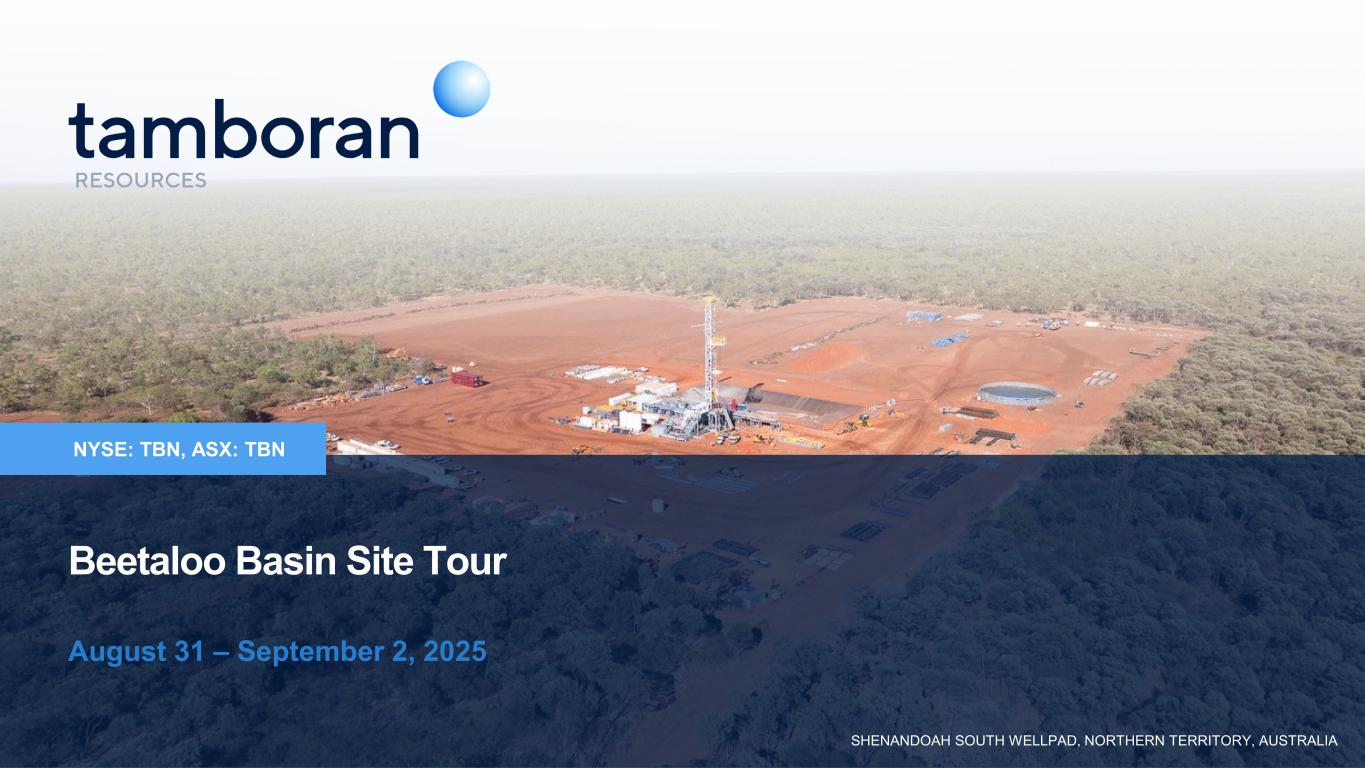
NYSE: TBN, ASX: TBN Beetaloo Basin Site Tour August 31 – September 2, 2025 SHENANDOAH SOUTH WELLPAD, NORTHERN TERRITORY, AUSTRALIA
The information in this presentation includes “forward-looking statements” within the meaning of Section 27A of the Securities Act of 1933, as amended (the “Securities Act”), and Section 21E of the Securities Exchange Act of 1934, as amended (the “Exchange Act”), which include statements on Tamboran Resources Corporation's ("we", "us" or the "Company") opinions, expectations, beliefs, plans objectives, assumptions or projections regarding future events or future results. All statements, other than statements of historical fact included in this presentation regarding our strategy, present and future operations, financial position, estimated revenues and losses, projected costs, estimated reserves, prospects, plans and objectives of management are forward-looking statements. When used in this presentation, words such as “may,” “assume,” “forecast,” “could,” “should,” “will,” “plan,” “believe,” “anticipate,” “intend,” “estimate,” “expect,” “project,” “budget”, "achieve," "progress," "target," "expand," "deliver“, "potential," "propose," "enter," "provide," "contribute," and similar expressions are used to identify forward-looking statements, although not all forward-looking statements contain such identifying words. These forward-looking statements are based on management’s current belief, based on currently available information, as to the outcome and timing of future events at the time such statement was made. These forward‐looking statements are not a guarantee of our performance, and you should not place undue reliance on such statements. Forward looking statements may include statements about, among other things: our business strategy and the successful implementation of our business strategy; our future reserves; our financial strategy, liquidity and capital required for our development programs; estimated natural gas prices; our dividend policy; the timing and amount of future production of natural gas; our drilling and production plans; competition and government regulation; our ability to obtain and retain permits and governmental approvals; legal, regulatory or environmental matters; marketing of natural gas; business or leasehold acquisitions and integration of acquired businesses; our ability to develop our properties; the availability and cost of developing appropriate infrastructure around and transportation to our properties; the availability and cost of drilling rigs, production equipment, supplies, personnel and oilfield services; costs of developing our properties and of conducting our operations; our ability to reach FID and execute and complete our planned pipeline or planned LNG export projects; our anticipated Scope 1, Scope 2 and Scope 3 emissions from our businesses and our plans to offset our Scope 1, Scope 2 and Scope 3 emissions from our business; our ESG strategy and initiatives, including those relating to the generation and marketing of environmental attributes or new products seeking to benefit from ESG related activities; general economic conditions, including cost inflation; credit markets and the ability to obtain future financing on commercially acceptable terms; our ability to expand our business, including through the recruitment and retention of skilled personnel; our dependence on our key management personnel; our future operating results; and our plans, objectives, expectations and intentions. Except as otherwise required by applicable law, we disclaim any duty to update any forward-looking statements, all of which are expressly qualified by the statements in this section, to reflect events or circumstances after the date of this presentation. Tamboran is subject to known and unknown risks, many of which are beyond the ability of Tamboran to control or predict. These risks may include, for example, movements in oil and gas prices, risks associated with the development and operation of the acreage, exchange rate fluctuations, an inability to obtain funding on acceptable terms or at all, loss of key personnel, an inability to obtain appropriate licenses, permits and or/or other approvals, inaccuracies in resource estimates, share market risks and changes in general economic conditions. Such risks may affect actual and future results of Tamboran and its securities. Maps and diagrams contained in this presentation are provided to assist with the identification and description of Tamboran’s interests. The maps and diagrams may not be drawn to scale. This presentation includes market data and other statistical information from third party sources, including independent industry publications, government publications or other published independent sources. Although we believe these third-party sources are reliable as of their respective dates, we have not independently verified the accuracy or completeness of this information. The industry in which we operate is subject to a high degree of uncertainty and risk due to a variety of factors, which could cause our results to differ materially from those expressed in these third-party publications. Numbers in this report have been rounded. As a result, some figures may differ insignificantly due to rounding and totals reported may differ insignificantly from arithmetic addition of the rounded numbers. All currency amounts are represented as USD unless otherwise stated (AUD/USD exchange rate of 0.65). This presentation does not purport to be all inclusive or to necessarily contain all the information that you may need or desire to perform your analysis. In all cases, you should conduct your own investigation and analysis of the data set forth in this presentation, and should rely solely on your own judgment, review and analysis in evaluating this presentation. This presentation contains trademarks, tradenames and servicemarks of other companies that are the property of their respective owners. We do not intend our use or display of other companies’ trademarks, tradenames and servicemarks to imply relationships with, or endorsement or sponsorship of us by, these other companies. APA Group has not prepared, and was not responsible for the preparation of, this presentation. It does not make any statement contained in it and has not caused or authorised its release. To the maximum extent permitted by law, APA Group expressly disclaims any liability in connection with this presentation, and any statement contained in it. This presentation was approved and authorised for release by Mr. Dick Stoneburner, Chairman and Interim Chief Executive Officer of Tamboran Resources Corporation. Disclaimer 2

Company overview
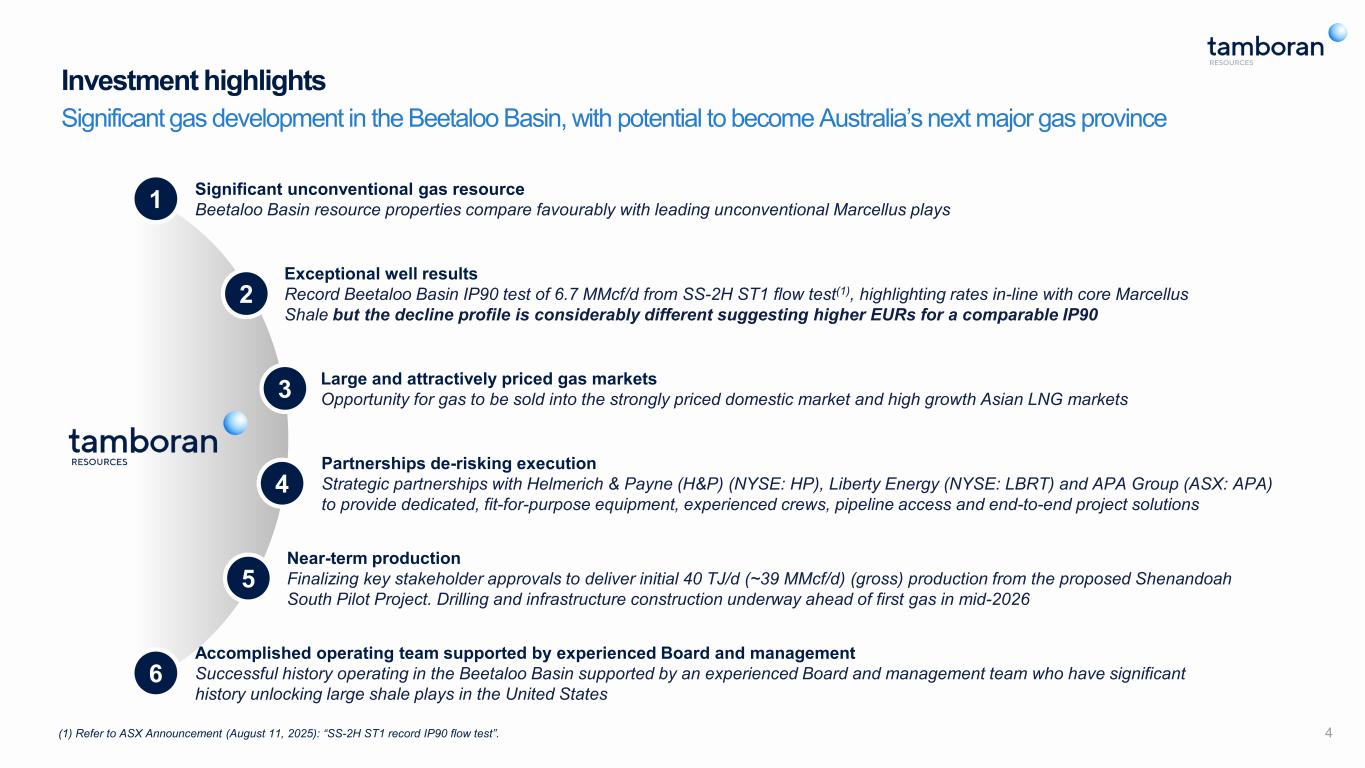
4 Investment highlights Significant gas development in the Beetaloo Basin, with potential to become Australia’s next major gas province Significant unconventional gas resource Beetaloo Basin resource properties compare favourably with leading unconventional Marcellus plays1 Exceptional well results Record Beetaloo Basin IP90 test of 6.7 MMcf/d from SS-2H ST1 flow test(1), highlighting rates in-line with core Marcellus Shale but the decline profile is considerably different suggesting higher EURs for a comparable IP90 2 Large and attractively priced gas markets Opportunity for gas to be sold into the strongly priced domestic market and high growth Asian LNG markets 3 Near-term production Finalizing key stakeholder approvals to deliver initial 40 TJ/d (~39 MMcf/d) (gross) production from the proposed Shenandoah South Pilot Project. Drilling and infrastructure construction underway ahead of first gas in mid-2026 5 6 Accomplished operating team supported by experienced Board and management Successful history operating in the Beetaloo Basin supported by an experienced Board and management team who have significant history unlocking large shale plays in the United States Partnerships de-risking execution Strategic partnerships with Helmerich & Payne (H&P) (NYSE: HP), Liberty Energy (NYSE: LBRT) and APA Group (ASX: APA) to provide dedicated, fit-for-purpose equipment, experienced crews, pipeline access and end-to-end project solutions 4 (1) Refer to ASX Announcement (August 11, 2025): “SS-2H ST1 record IP90 flow test”.
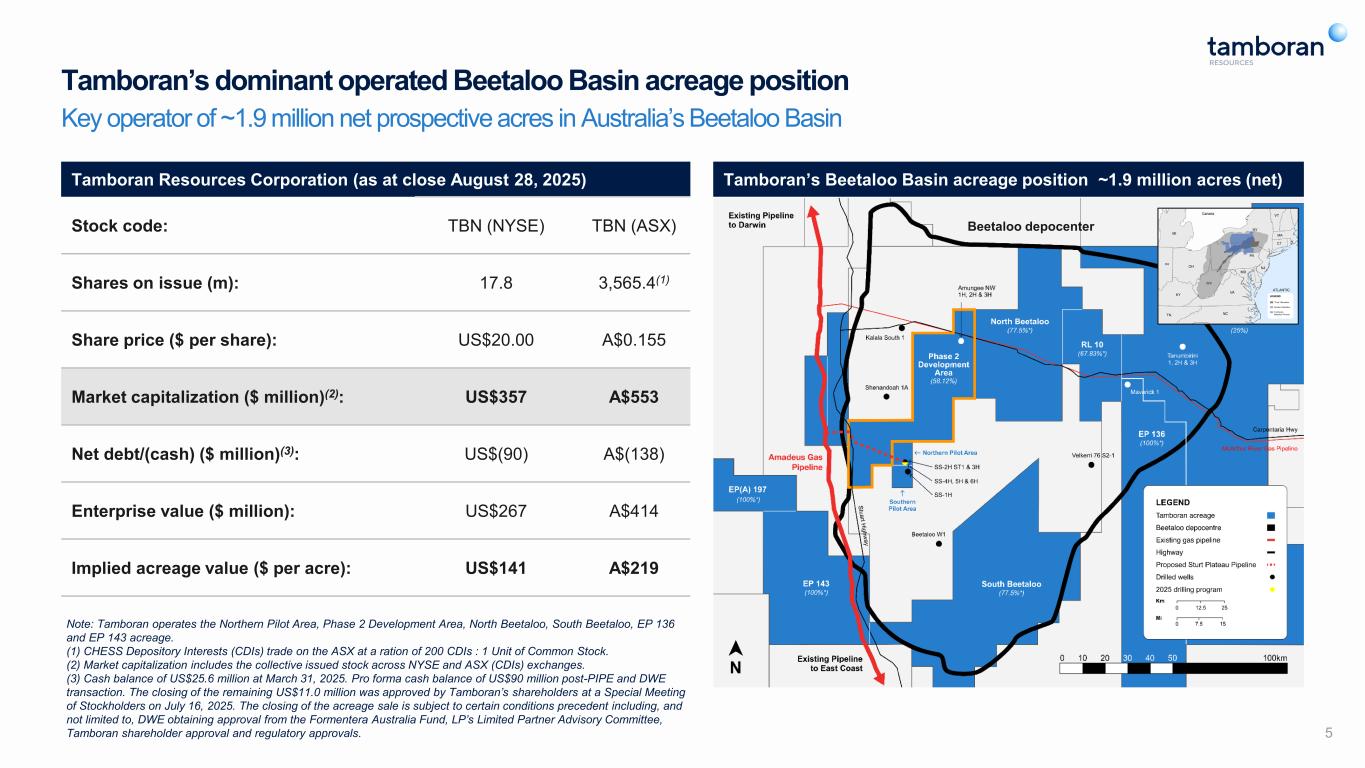
Tamboran Resources Corporation (as at close August 28, 2025) Stock code: TBN (NYSE) TBN (ASX) Shares on issue (m): 17.8 3,565.4(1) Share price ($ per share): US$20.00 A$0.155 Market capitalization ($ million)(2): US$357 A$553 Net debt/(cash) ($ million)(3): US$(90) A$(138) Enterprise value ($ million): US$267 A$414 Implied acreage value ($ per acre): US$141 A$219 5 Note: Tamboran operates the Northern Pilot Area, Phase 2 Development Area, North Beetaloo, South Beetaloo, EP 136 and EP 143 acreage. (1) CHESS Depository Interests (CDIs) trade on the ASX at a ration of 200 CDIs : 1 Unit of Common Stock. (2) Market capitalization includes the collective issued stock across NYSE and ASX (CDIs) exchanges. (3) Cash balance of US$25.6 million at March 31, 2025. Pro forma cash balance of US$90 million post-PIPE and DWE transaction. The closing of the remaining US$11.0 million was approved by Tamboran’s shareholders at a Special Meeting of Stockholders on July 16, 2025. The closing of the acreage sale is subject to certain conditions precedent including, and not limited to, DWE obtaining approval from the Formentera Australia Fund, LP’s Limited Partner Advisory Committee, Tamboran shareholder approval and regulatory approvals. Beetaloo depocenter LEGEND “Core” Marcellus Greater Marcellus Tamboran Beetaloo Permits Tamboran’s dominant operated Beetaloo Basin acreage position Key operator of ~1.9 million net prospective acres in Australia’s Beetaloo Basin Tamboran’s Beetaloo Basin acreage position ~1.9 million acres (net)
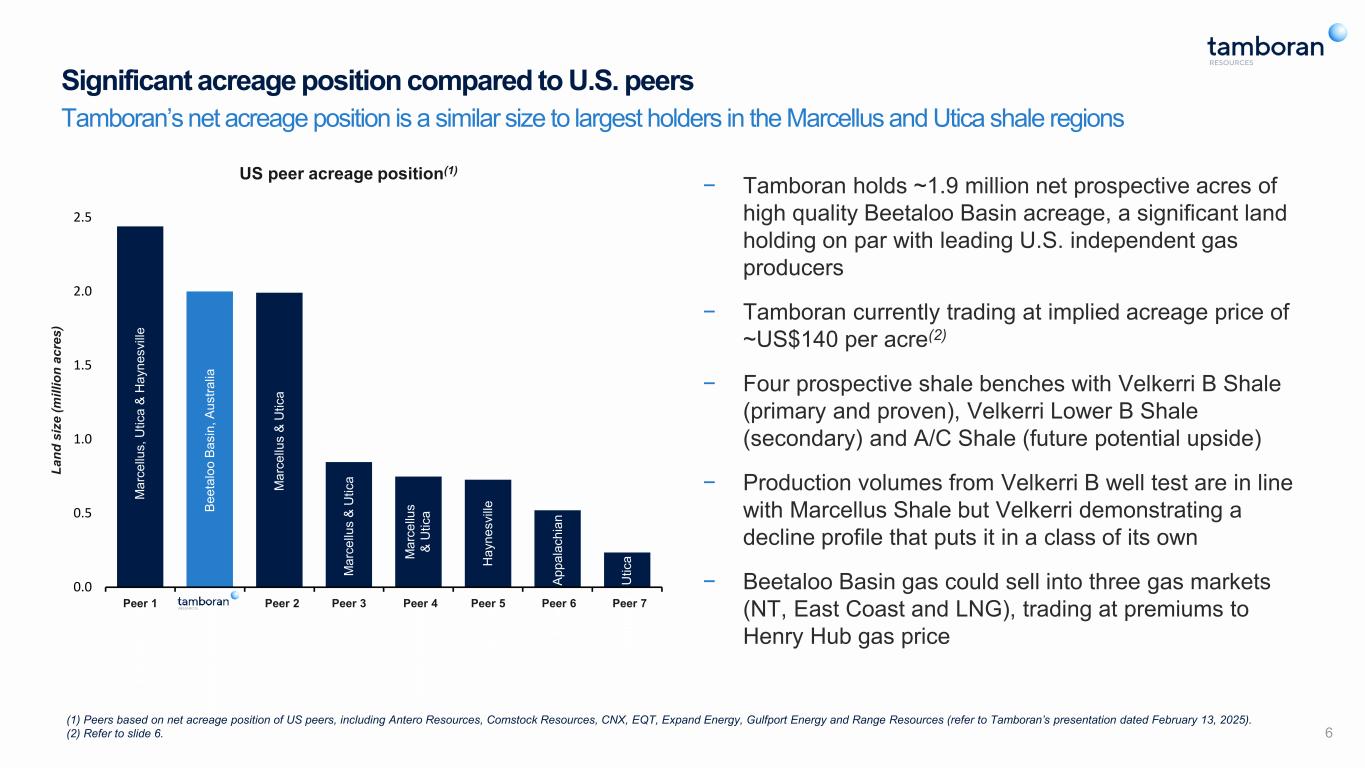
6 Significant acreage position compared to U.S. peers Tamboran’s net acreage position is a similar size to largest holders in the Marcellus and Utica shale regions M ar ce llu s & U tic a M ar ce llu s & U tic a Ap pa la ch ia & H ay ne sv ille M ar ce llu s & H ay ne sv ille M ar ce llu s & U tic a Ap pa la ch ia n Be et al oo B as in , A us tra lia U tic a H ay ne sv ille US peer acreage position(1) La nd s iz e (m ill io n ac re s) M ar ce llu s & U tic a 0.0 0.5 1.0 1.5 2.0 2.5 Ex pa nd E ne rg y Ta m bo ra n Re so ur ce s EQ T CN X Ra ng e Re so ur ce s Co m st oc k An te ro Gu lfp or t M ar ce llu s, U tic a & H ay ne sv ille Be et al oo B as in , A us tra lia M ar ce llu s & U tic a M ar ce llu s & U tic a M ar ce llu s & U tic a H ay ne sv ille Ap pa la ch ia n U tic a Peer 1 Peer 2 Peer 3 Peer 4 Peer 5 Peer 6 Pee 7 − Tamboran holds ~1.9 million net prospective acres of high quality Beetaloo Basin acreage, a significant land holding on par with leading U.S. independent gas producers − Tamboran currently trading at implied acreage price of ~US$140 per acre(2) − Four prospective shale benches with Velkerri B Shale (primary and proven), Velkerri Lower B Shale (secondary) and A/C Shale (future potential upside) − Production volumes from Velkerri B well test are in line with Marcellus Shale but Velkerri demonstrating a decline profile that puts it in a class of its own − Beetaloo Basin gas could sell into three gas markets (NT, East Coast and LNG), trading at premiums to Henry Hub gas price (1) Peers based on net acreage position of US peers, including Antero Resources, Comstock Resources, CNX, EQT, Expand Energy, Gulfport Energy and Range Resources (refer to Tamboran’s presentation dated February 13, 2025). (2) Refer to slide 6.
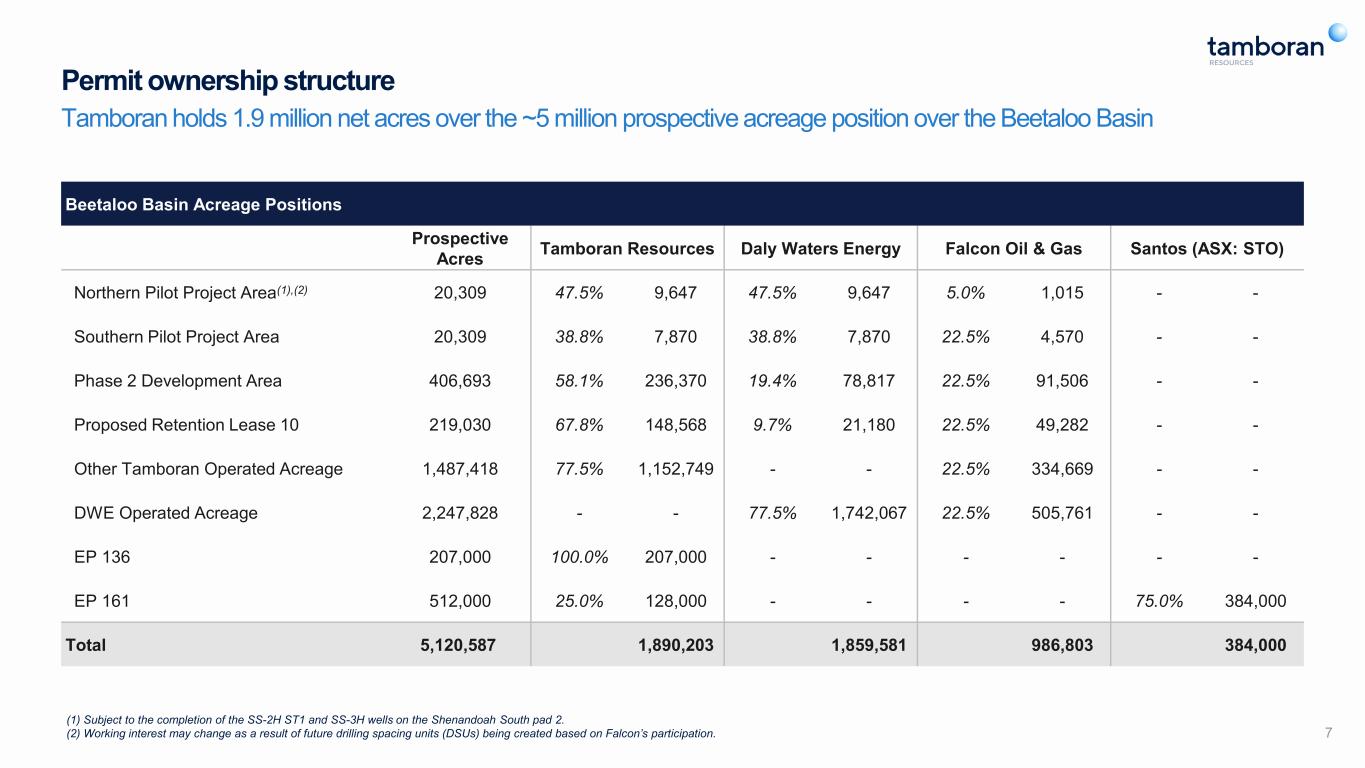
Permit ownership structure Tamboran holds 1.9 million net acres over the ~5 million prospective acreage position over the Beetaloo Basin 7 Beetaloo Basin Acreage Positions Prospective Acres Tamboran Resources Daly Waters Energy Falcon Oil & Gas Santos (ASX: STO) Northern Pilot Project Area(1),(2) 20,309 47.5% 9,647 47.5% 9,647 5.0% 1,015 - - Southern Pilot Project Area 20,309 38.8% 7,870 38.8% 7,870 22.5% 4,570 - - Phase 2 Development Area 406,693 58.1% 236,370 19.4% 78,817 22.5% 91,506 - - Proposed Retention Lease 10 219,030 67.8% 148,568 9.7% 21,180 22.5% 49,282 - - Other Tamboran Operated Acreage 1,487,418 77.5% 1,152,749 - - 22.5% 334,669 - - DWE Operated Acreage 2,247,828 - - 77.5% 1,742,067 22.5% 505,761 - - EP 136 207,000 100.0% 207,000 - - - - - - EP 161 512,000 25.0% 128,000 - - - - 75.0% 384,000 Total 5,120,587 1,890,203 1,859,581 986,803 384,000 (1) Subject to the completion of the SS-2H ST1 and SS-3H wells on the Shenandoah South pad 2. (2) Working interest may change as a result of future drilling spacing units (DSUs) being created based on Falcon’s participation.
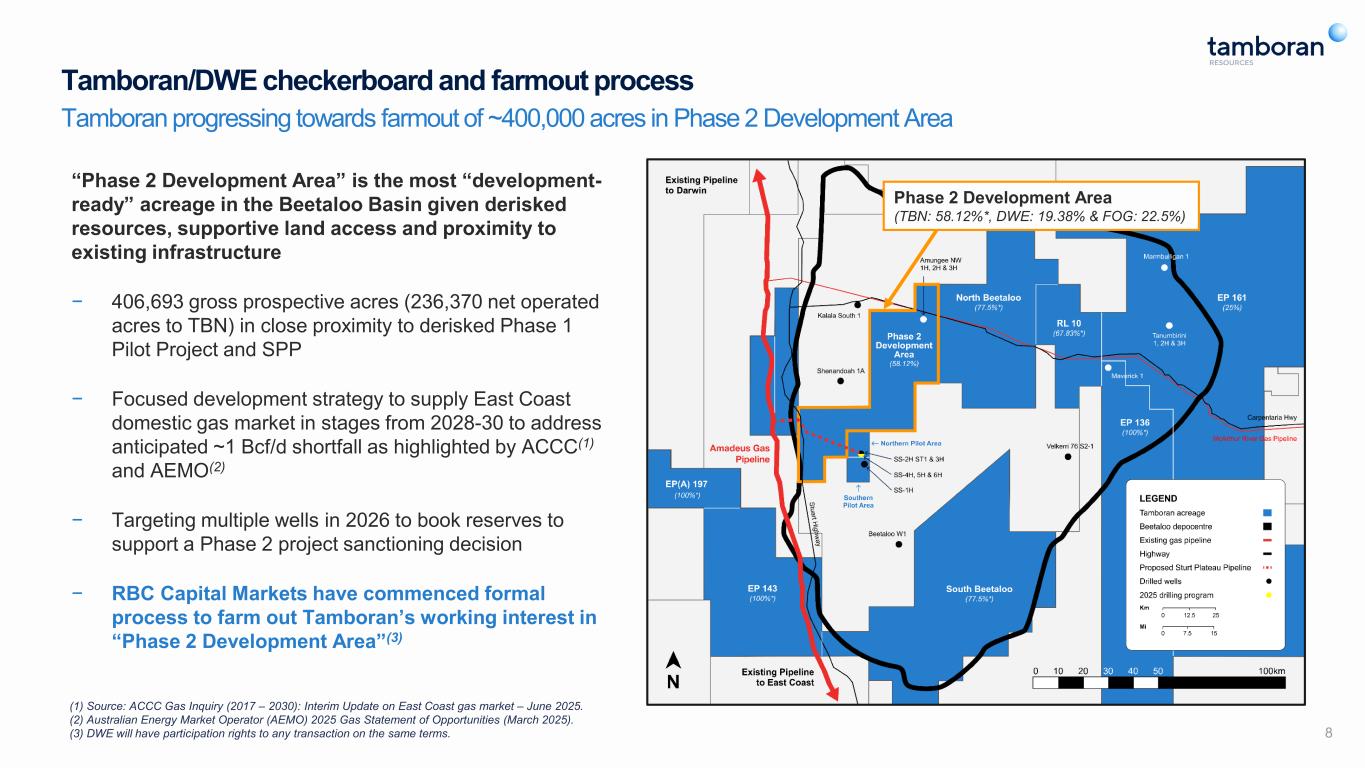
Tamboran/DWE checkerboard and farmout process Tamboran progressing towards farmout of ~400,000 acres in Phase 2 Development Area “Phase 2 Development Area” is the most “development- ready” acreage in the Beetaloo Basin given derisked resources, supportive land access and proximity to existing infrastructure − 406,693 gross prospective acres (236,370 net operated acres to TBN) in close proximity to derisked Phase 1 Pilot Project and SPP − Focused development strategy to supply East Coast domestic gas market in stages from 2028-30 to address anticipated ~1 Bcf/d shortfall as highlighted by ACCC(1) and AEMO(2) − Targeting multiple wells in 2026 to book reserves to support a Phase 2 project sanctioning decision − RBC Capital Markets have commenced formal process to farm out Tamboran’s working interest in “Phase 2 Development Area”(3) 8 (1) Source: ACCC Gas Inquiry (2017 – 2030): Interim Update on East Coast gas market – June 2025. (2) Australian Energy Market Operator (AEMO) 2025 Gas Statement of Opportunities (March 2025). (3) DWE will have participation rights to any transaction on the same terms. Phase 2 Development Area (TBN: 58.12%*, DWE: 19.38% & FOG: 22.5%)
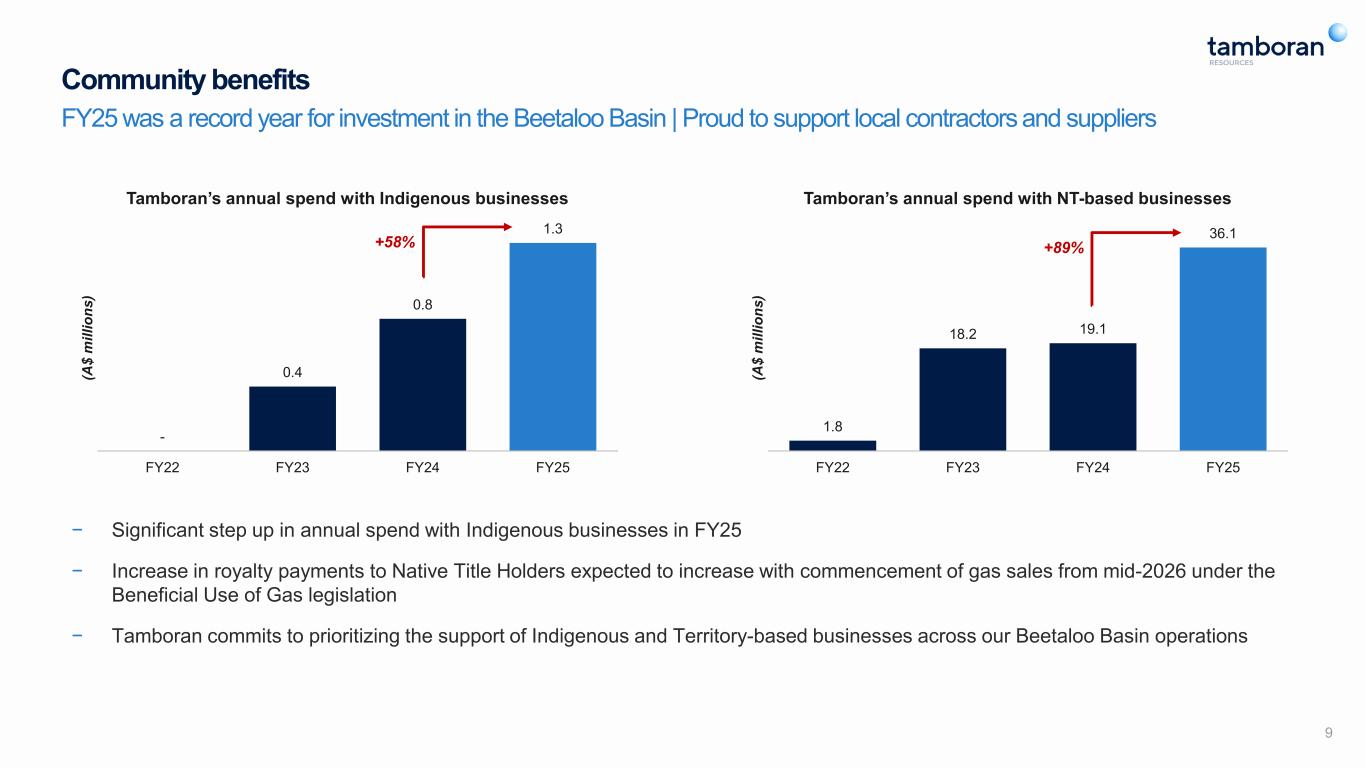
Community benefits FY25 was a record year for investment in the Beetaloo Basin | Proud to support local contractors and suppliers 9 1.8 18.2 19.1 36.1 FY22 FY23 FY24 FY25 (A $ m ill io ns ) Tamboran’s annual spend with NT-based businesses - 0.4 0.8 1.3 FY22 FY23 FY24 FY25 (A $ m ill io ns ) Tamboran’s annual spend with Indigenous businesses − Significant step up in annual spend with Indigenous businesses in FY25 − Increase in royalty payments to Native Title Holders expected to increase with commencement of gas sales from mid-2026 under the Beneficial Use of Gas legislation − Tamboran commits to prioritizing the support of Indigenous and Territory-based businesses across our Beetaloo Basin operations +58% +89%
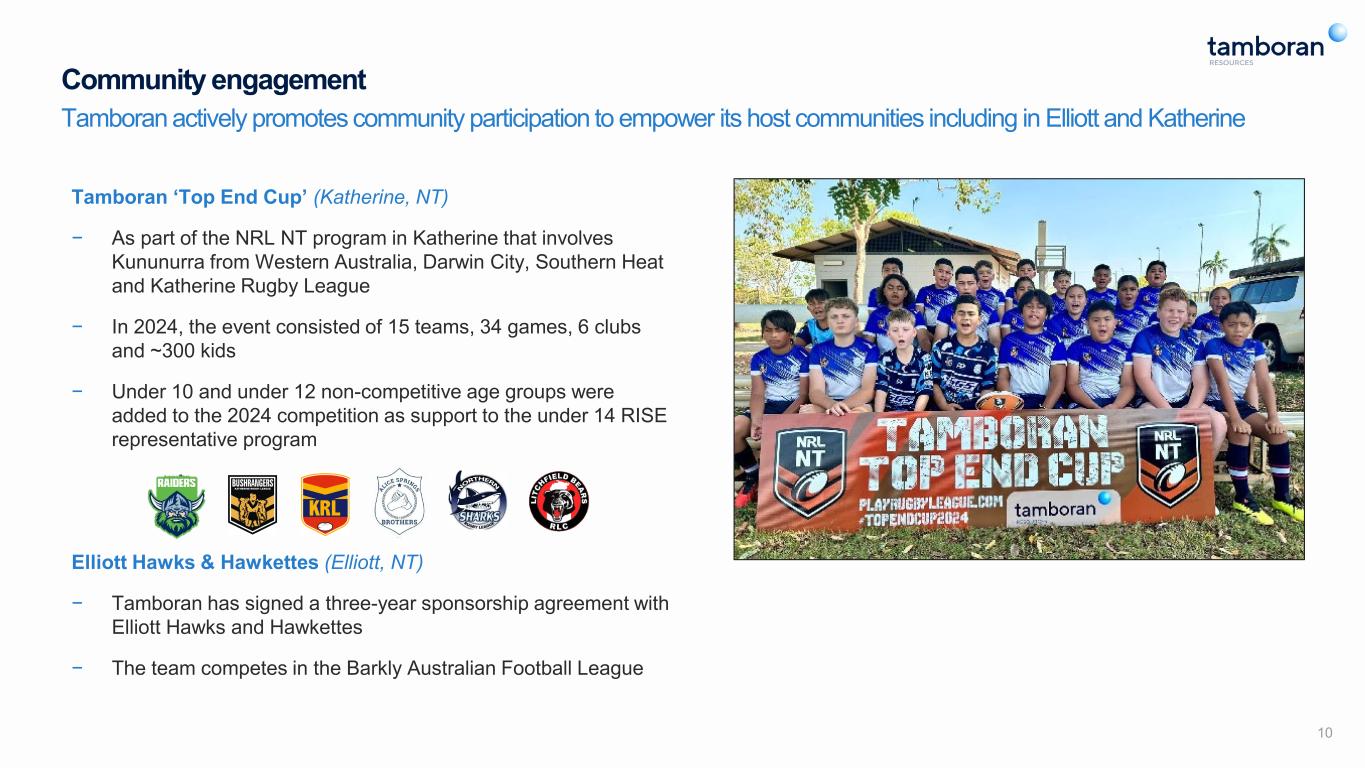
Community engagement Tamboran actively promotes community participation to empower its host communities including in Elliott and Katherine 10 Tamboran ‘Top End Cup’ (Katherine, NT) − As part of the NRL NT program in Katherine that involves Kununurra from Western Australia, Darwin City, Southern Heat and Katherine Rugby League − In 2024, the event consisted of 15 teams, 34 games, 6 clubs and ~300 kids − Under 10 and under 12 non-competitive age groups were added to the 2024 competition as support to the under 14 RISE representative program Elliott Hawks & Hawkettes (Elliott, NT) − Tamboran has signed a three-year sponsorship agreement with Elliott Hawks and Hawkettes − The team competes in the Barkly Australian Football League

Beetaloo Basin overview
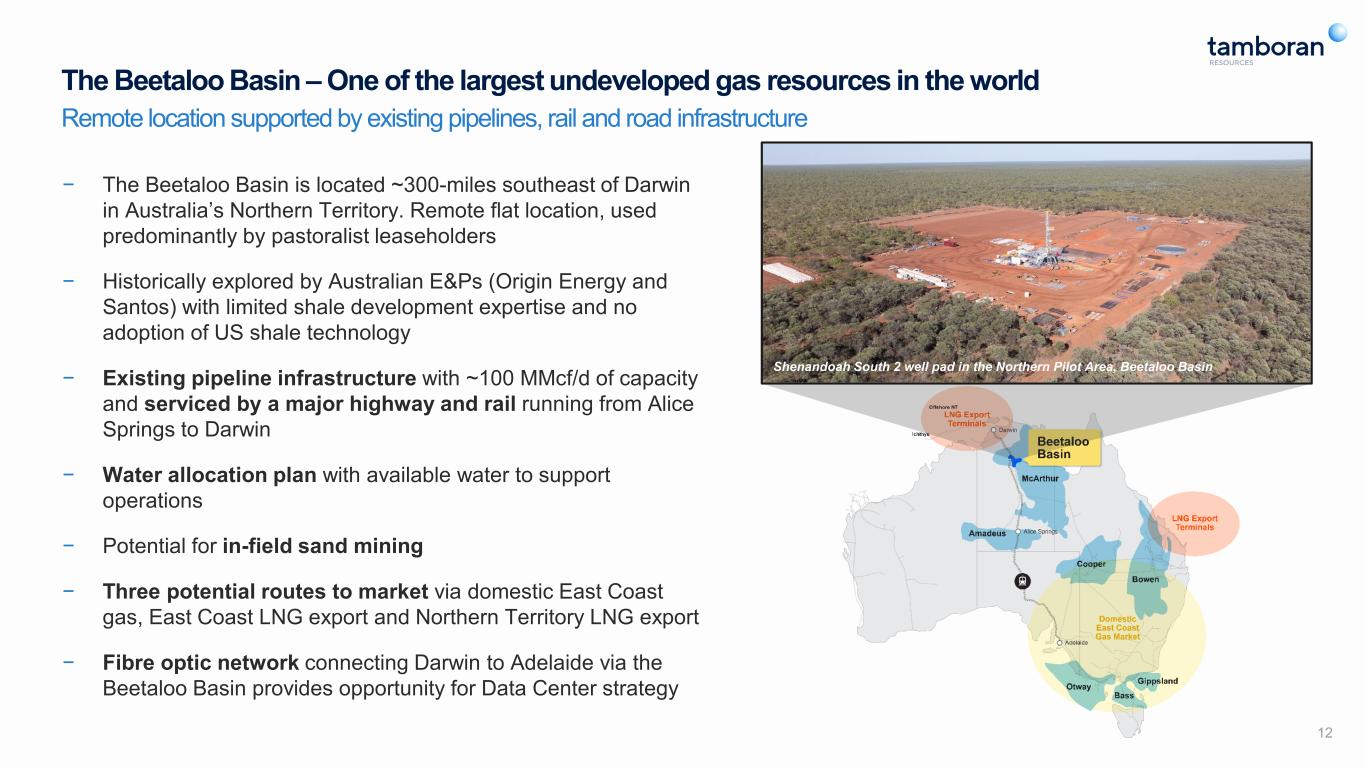
The Beetaloo Basin – One of the largest undeveloped gas resources in the world 12 Remote location supported by existing pipelines, rail and road infrastructure − The Beetaloo Basin is located ~300-miles southeast of Darwin in Australia’s Northern Territory. Remote flat location, used predominantly by pastoralist leaseholders − Historically explored by Australian E&Ps (Origin Energy and Santos) with limited shale development expertise and no adoption of US shale technology − Existing pipeline infrastructure with ~100 MMcf/d of capacity and serviced by a major highway and rail running from Alice Springs to Darwin − Water allocation plan with available water to support operations − Potential for in-field sand mining − Three potential routes to market via domestic East Coast gas, East Coast LNG export and Northern Territory LNG export − Fibre optic network connecting Darwin to Adelaide via the Beetaloo Basin provides opportunity for Data Center strategy Shenandoah South 2 well pad in the Northern Pilot Area, Beetaloo Basin
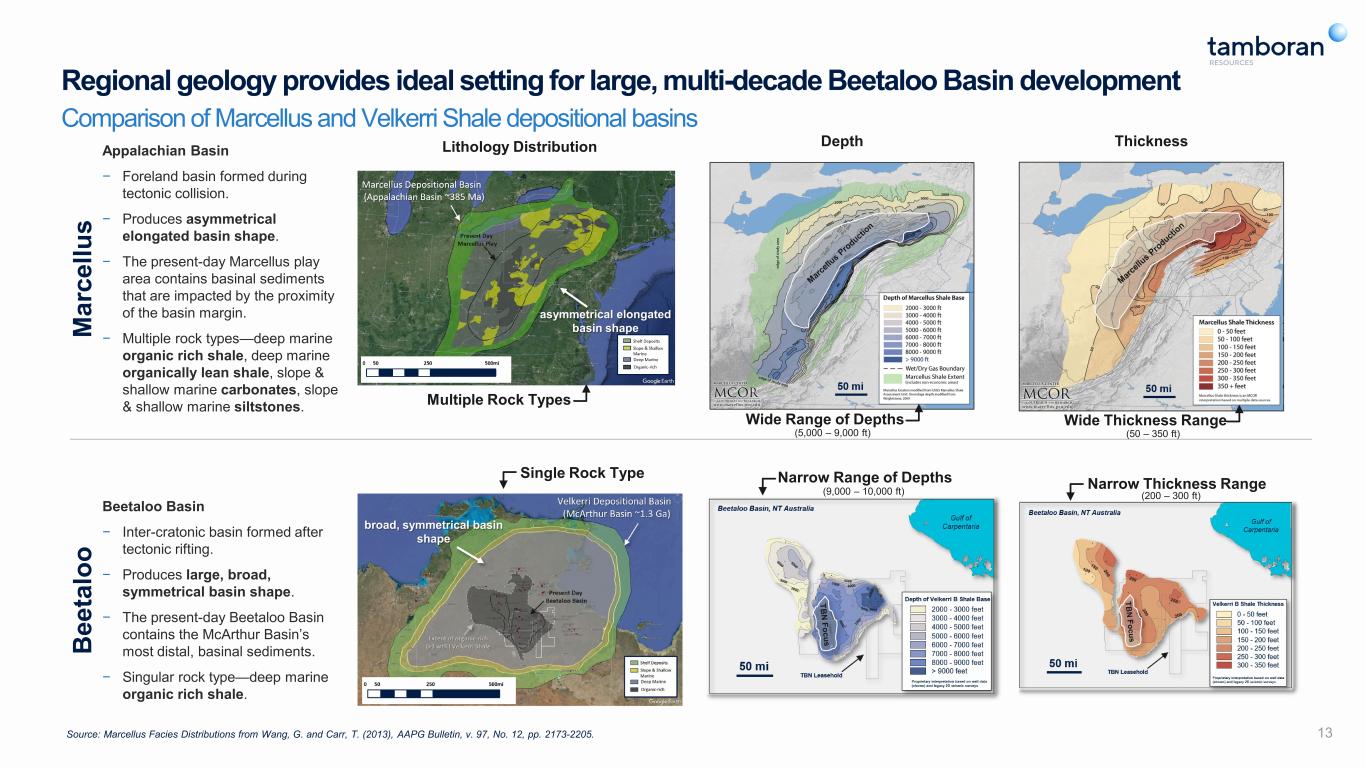
13 M ar ce llu s B ee ta lo o Appalachian Basin − Foreland basin formed during tectonic collision. − Produces asymmetrical elongated basin shape. − The present-day Marcellus play area contains basinal sediments that are impacted by the proximity of the basin margin. − Multiple rock types—deep marine organic rich shale, deep marine organically lean shale, slope & shallow marine carbonates, slope & shallow marine siltstones. Beetaloo Basin − Inter-cratonic basin formed after tectonic rifting. − Produces large, broad, symmetrical basin shape. − The present-day Beetaloo Basin contains the McArthur Basin’s most distal, basinal sediments. − Singular rock type—deep marine organic rich shale. asymmetrical elongated basin shape Multiple Rock Types broad, symmetrical basin shape Single Rock Type Lithology Distribution Depth Thickness Wide Range of Depths (5,000 – 9,000 ft) Wide Thickness Range (50 – 350 ft) Narrow Range of Depths (9,000 – 10,000 ft) Narrow Thickness Range (200 – 300 ft) Regional geology provides ideal setting for large, multi-decade Beetaloo Basin development Comparison of Marcellus and Velkerri Shale depositional basins Source: Marcellus Facies Distributions from Wang, G. and Carr, T. (2013), AAPG Bulletin, v. 97, No. 12, pp. 2173-2205.
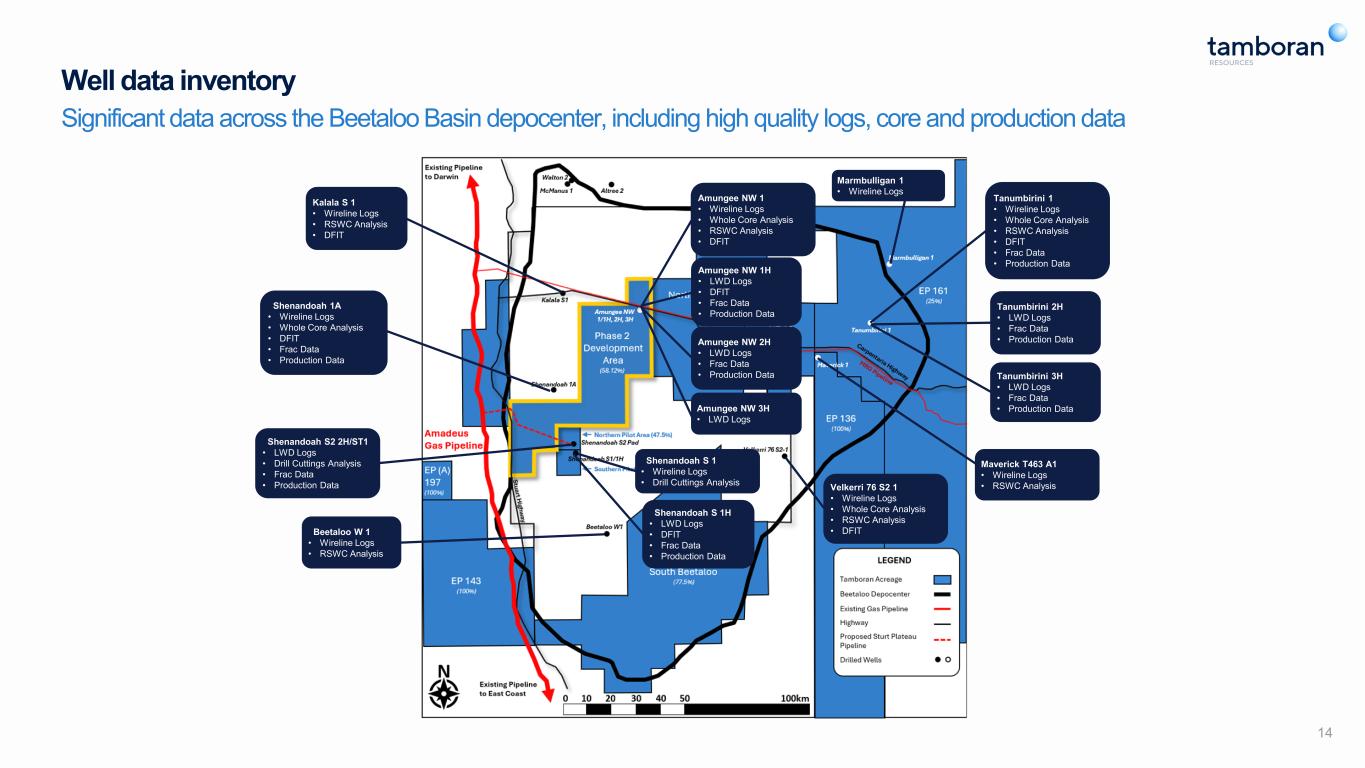
14 Well data inventory Significant data across the Beetaloo Basin depocenter, including high quality logs, core and production data Kalala S 1 • Wireline Logs • RSWC Analysis • DFIT Shenandoah 1A • Wireline Logs • Whole Core Analysis • DFIT • Frac Data • Production Data Beetaloo W 1 • Wireline Logs • RSWC Analysis Shenandoah S2 2H/ST1 • LWD Logs • Drill Cuttings Analysis • Frac Data • Production Data Amungee NW 1 • Wireline Logs • Whole Core Analysis • RSWC Analysis • DFIT Amungee NW 2H • LWD Logs • Frac Data • Production Data Amungee NW 3H • LWD Logs Amungee NW 1H • LWD Logs • DFIT • Frac Data • Production Data Shenandoah S 1 • Wireline Logs • Drill Cuttings Analysis Shenandoah S 1H • LWD Logs • DFIT • Frac Data • Production Data Tanumbirini 1 • Wireline Logs • Whole Core Analysis • RSWC Analysis • DFIT • Frac Data • Production Data Tanumbirini 2H • LWD Logs • Frac Data • Production Data Tanumbirini 3H • LWD Logs • Frac Data • Production Data Maverick T463 A1 • Wireline Logs • RSWC Analysis Velkerri 76 S2 1 • Wireline Logs • Whole Core Analysis • RSWC Analysis • DFIT Marmbulligan 1 • Wireline Logs
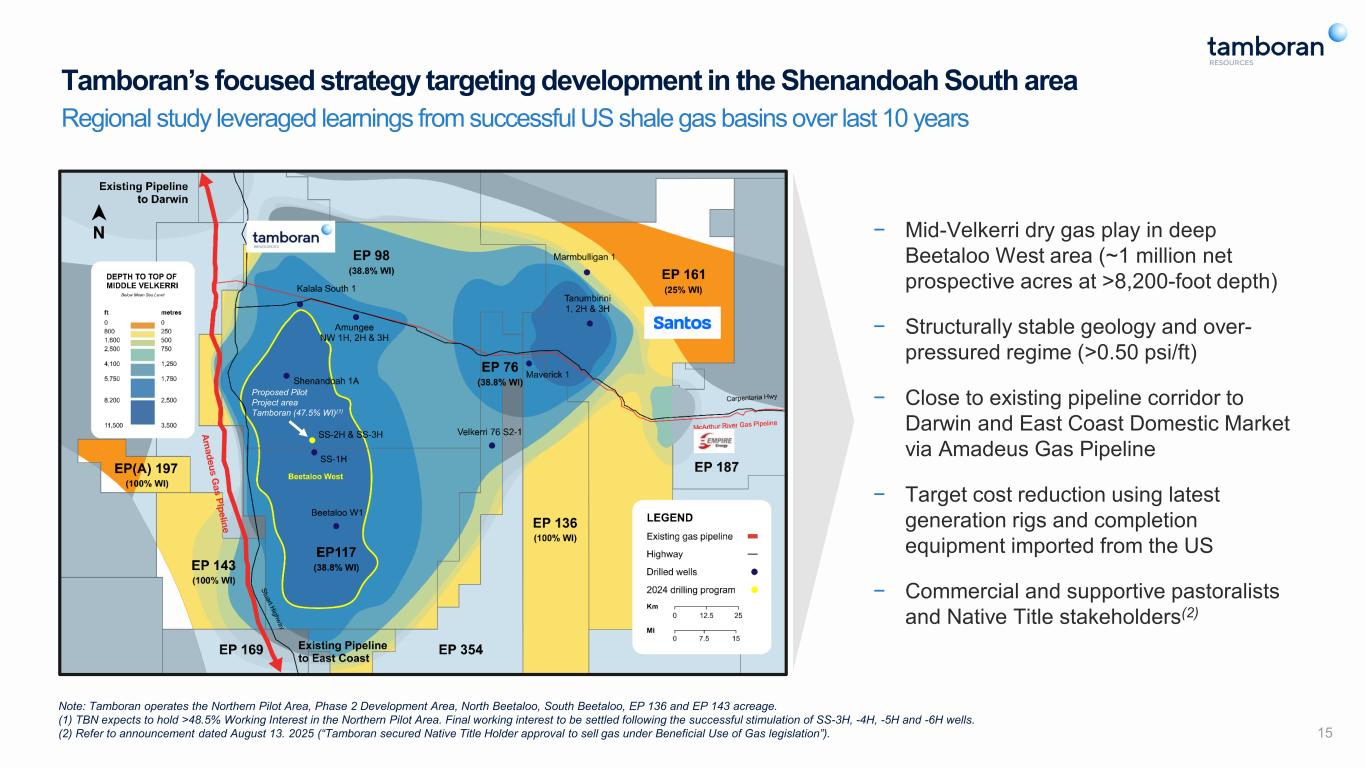
− Mid-Velkerri dry gas play in deep Beetaloo West area (~1 million net prospective acres at >8,200-foot depth) − Structurally stable geology and over- pressured regime (>0.50 psi/ft) − Close to existing pipeline corridor to Darwin and East Coast Domestic Market via Amadeus Gas Pipeline − Target cost reduction using latest generation rigs and completion equipment imported from the US − Commercial and supportive pastoralists and Native Title stakeholders(2) Note: Tamboran operates the Northern Pilot Area, Phase 2 Development Area, North Beetaloo, South Beetaloo, EP 136 and EP 143 acreage. (1) TBN expects to hold >48.5% Working Interest in the Northern Pilot Area. Final working interest to be settled following the successful stimulation of SS-3H, -4H, -5H and -6H wells. (2) Refer to announcement dated August 13. 2025 (“Tamboran secured Native Title Holder approval to sell gas under Beneficial Use of Gas legislation”). 15 Tamboran’s focused strategy targeting development in the Shenandoah South area Regional study leveraged learnings from successful US shale gas basins over last 10 years Proposed Pilot Project area Tamboran (47.5% WI)(1)
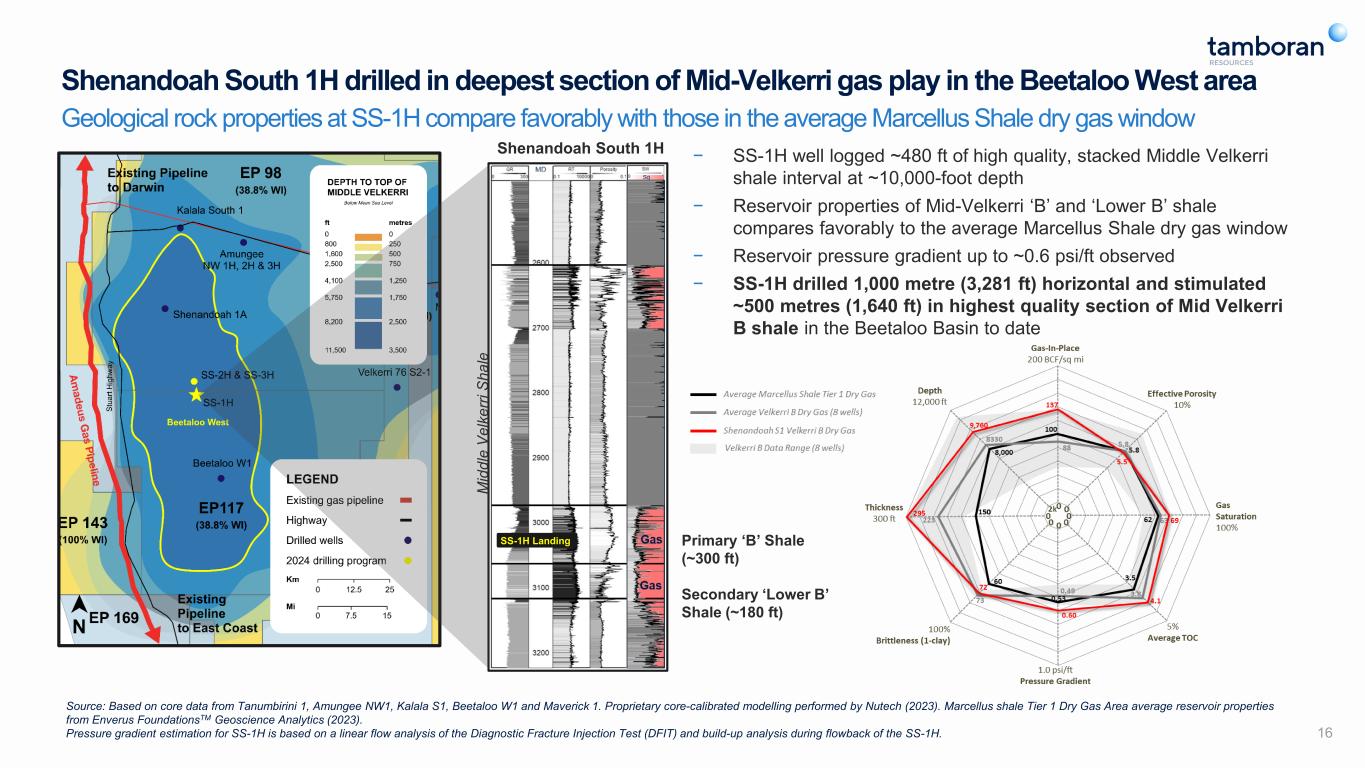
Shenandoah South 1H Primary ‘B’ Shale (~300 ft) Secondary ‘Lower B’ Shale (~180 ft) SS-1H Landing − SS-1H well logged ~480 ft of high quality, stacked Middle Velkerri shale interval at ~10,000-foot depth − Reservoir properties of Mid-Velkerri ‘B’ and ‘Lower B’ shale compares favorably to the average Marcellus Shale dry gas window − Reservoir pressure gradient up to ~0.6 psi/ft observed − SS-1H drilled 1,000 metre (3,281 ft) horizontal and stimulated ~500 metres (1,640 ft) in highest quality section of Mid Velkerri B shale in the Beetaloo Basin to date 16 M id dl e V el ke rri S ha le Source: Based on core data from Tanumbirini 1, Amungee NW1, Kalala S1, Beetaloo W1 and Maverick 1. Proprietary core-calibrated modelling performed by Nutech (2023). Marcellus shale Tier 1 Dry Gas Area average reservoir properties from Enverus FoundationsTM Geoscience Analytics (2023). Pressure gradient estimation for SS-1H is based on a linear flow analysis of the Diagnostic Fracture Injection Test (DFIT) and build-up analysis during flowback of the SS-1H. Shenandoah South 1H drilled in deepest section of Mid-Velkerri gas play in the Beetaloo West area Geological rock properties at SS-1H compare favorably with those in the average Marcellus Shale dry gas window
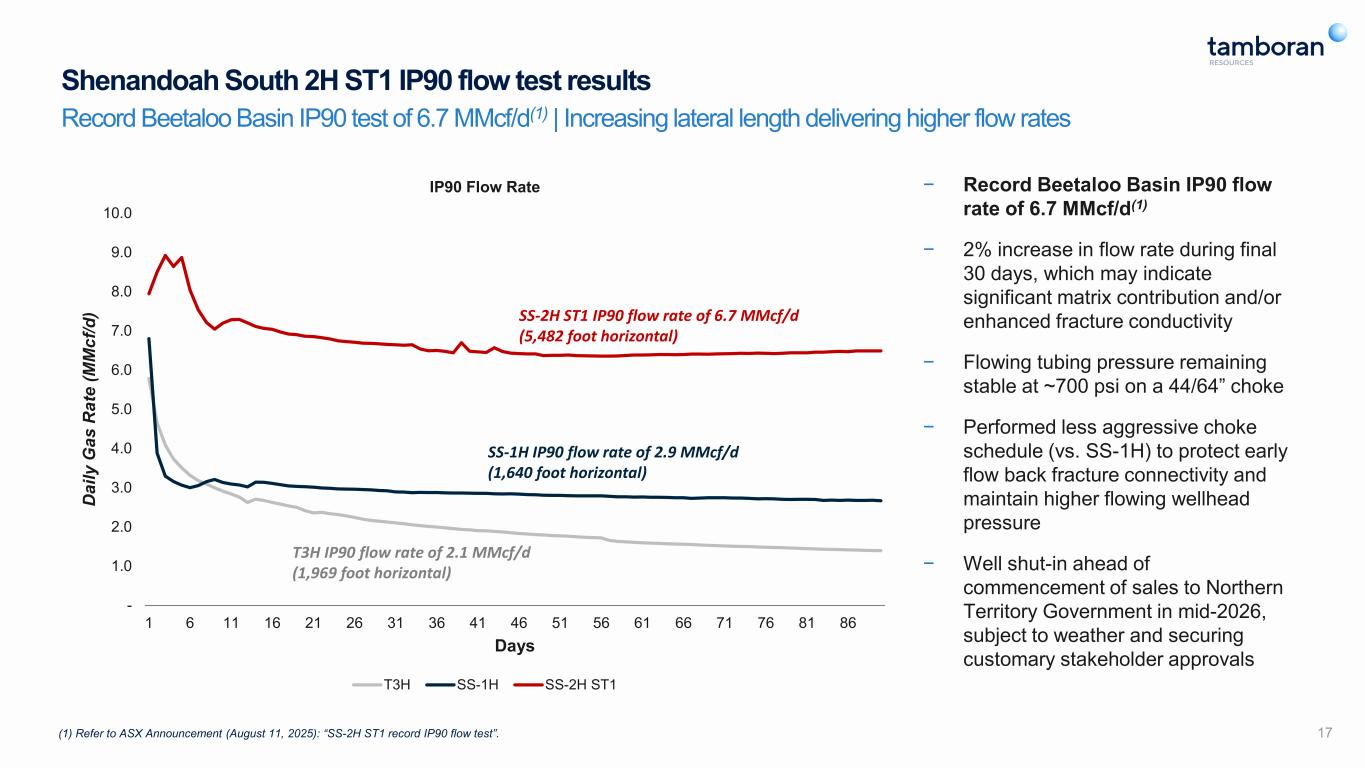
- 1.0 2.0 3.0 4.0 5.0 6.0 7.0 8.0 9.0 10.0 1 6 11 16 21 26 31 36 41 46 51 56 61 66 71 76 81 86 D ai ly G as R at e (M M cf /d ) Days IP90 Flow Rate T3H SS-1H SS-2H ST1 − Record Beetaloo Basin IP90 flow rate of 6.7 MMcf/d(1) − 2% increase in flow rate during final 30 days, which may indicate significant matrix contribution and/or enhanced fracture conductivity − Flowing tubing pressure remaining stable at ~700 psi on a 44/64” choke − Performed less aggressive choke schedule (vs. SS-1H) to protect early flow back fracture connectivity and maintain higher flowing wellhead pressure − Well shut-in ahead of commencement of sales to Northern Territory Government in mid-2026, subject to weather and securing customary stakeholder approvals 17 Shenandoah South 2H ST1 IP90 flow test results Record Beetaloo Basin IP90 test of 6.7 MMcf/d(1) | Increasing lateral length delivering higher flow rates SS-1H IP90 flow rate of 2.9 MMcf/d (1,640 foot horizontal) SS-2H ST1 IP90 flow rate of 6.7 MMcf/d (5,482 foot horizontal) T3H IP90 flow rate of 2.1 MMcf/d (1,969 foot horizontal) (1) Refer to ASX Announcement (August 11, 2025): “SS-2H ST1 record IP90 flow test”.
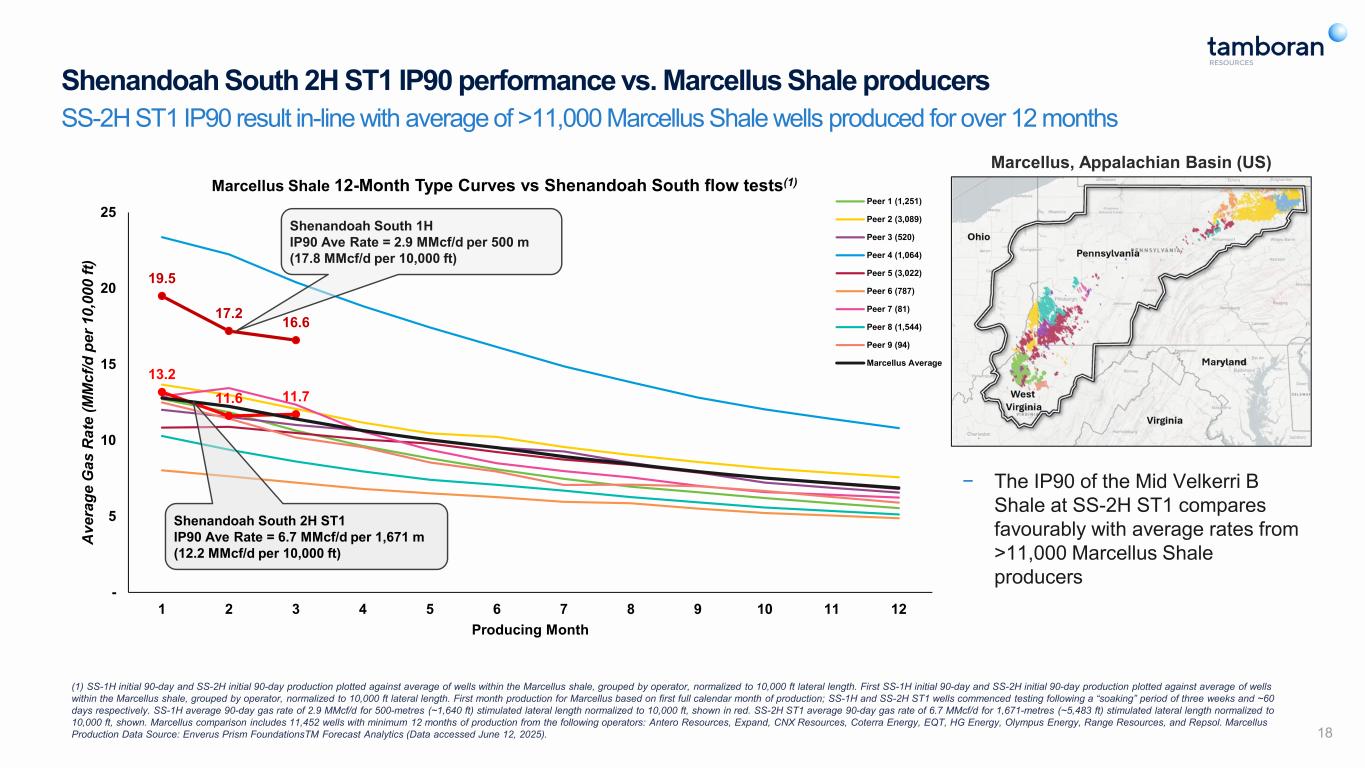
(1) SS-1H initial 90-day and SS-2H initial 90-day production plotted against average of wells within the Marcellus shale, grouped by operator, normalized to 10,000 ft lateral length. First SS-1H initial 90-day and SS-2H initial 90-day production plotted against average of wells within the Marcellus shale, grouped by operator, normalized to 10,000 ft lateral length. First month production for Marcellus based on first full calendar month of production; SS-1H and SS-2H ST1 wells commenced testing following a “soaking” period of three weeks and ~60 days respectively. SS-1H average 90-day gas rate of 2.9 MMcf/d for 500-metres (~1,640 ft) stimulated lateral length normalized to 10,000 ft, shown in red. SS-2H ST1 average 90-day gas rate of 6.7 MMcf/d for 1,671-metres (~5,483 ft) stimulated lateral length normalized to 10,000 ft, shown. Marcellus comparison includes 11,452 wells with minimum 12 months of production from the following operators: Antero Resources, Expand, CNX Resources, Coterra Energy, EQT, HG Energy, Olympus Energy, Range Resources, and Repsol. Marcellus Production Data Source: Enverus Prism FoundationsTM Forecast Analytics (Data accessed June 12, 2025). 18 Shenandoah South 2H ST1 IP90 performance vs. Marcellus Shale producers SS-2H ST1 IP90 result in-line with average of >11,000 Marcellus Shale wells produced for over 12 months 19.5 17.2 16.6 13.2 11.6 11.7 - 5 10 15 20 25 1 2 3 4 5 6 7 8 9 10 11 12 A ve ra ge G as R at e (M M cf /d p er 1 0, 00 0 ft) Producing Month Marcellus Shale 12-Month Type Curves vs Shenandoah South flow tests(1) Peer 1 (1,251) Peer 2 (3,089) Peer 3 (520) Peer 4 (1,064) Peer 5 (3,022) Peer 6 (787) Peer 7 (81) Peer 8 (1,544) Peer 9 (94) Marcellus Average Shenandoah South 1H IP90 Ave Rate = 2.9 MMcf/d per 500 m (17.8 MMcf/d per 10,000 ft) Shenandoah South 2H ST1 IP90 Ave Rate = 6.7 MMcf/d per 1,671 m (12.2 MMcf/d per 10,000 ft) Marcellus, Appalachian Basin (US) − The IP90 of the Mid Velkerri B Shale at SS-2H ST1 compares favourably with average rates from >11,000 Marcellus Shale producers
Phase 1 – Proposed Shenandoah South Pilot Project
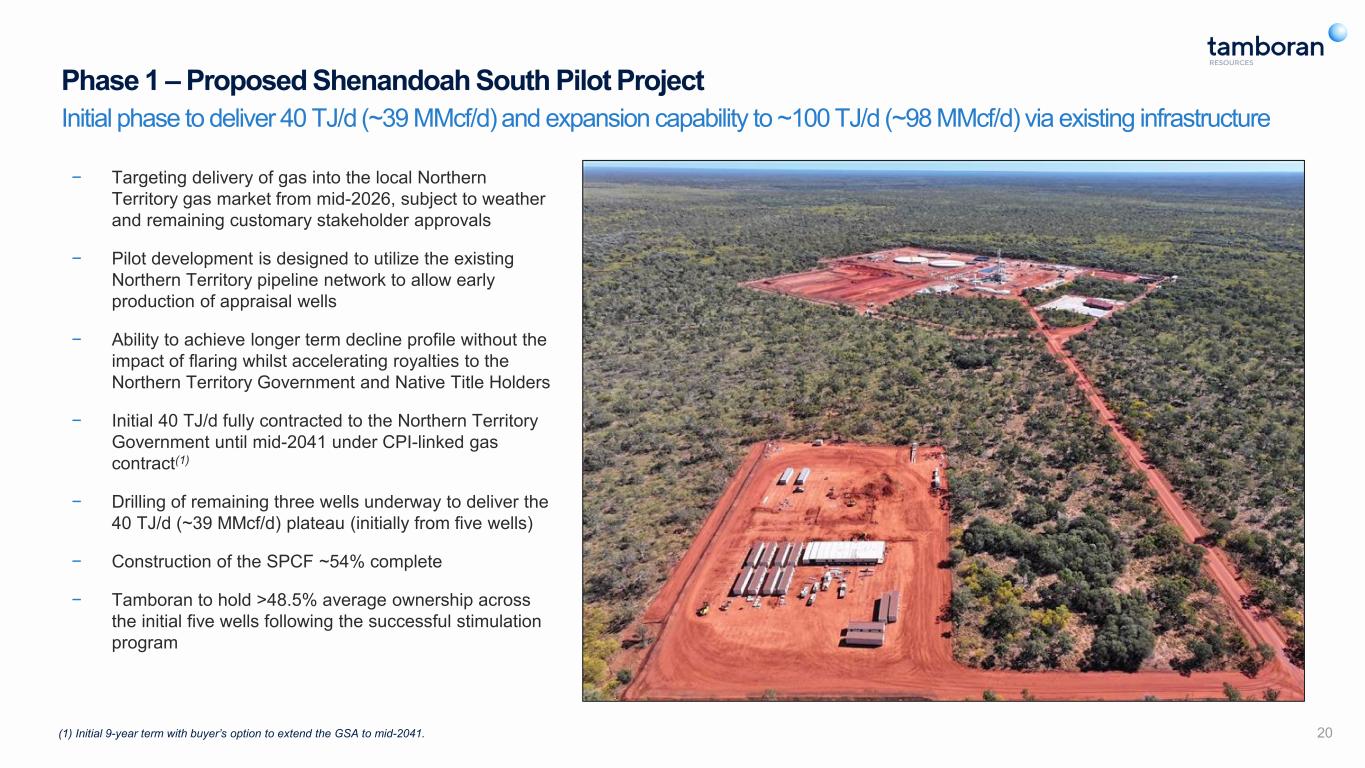
Phase 1 – Proposed Shenandoah South Pilot Project Initial phase to deliver 40 TJ/d (~39 MMcf/d) and expansion capability to ~100 TJ/d (~98 MMcf/d) via existing infrastructure 20 − Targeting delivery of gas into the local Northern Territory gas market from mid-2026, subject to weather and remaining customary stakeholder approvals − Pilot development is designed to utilize the existing Northern Territory pipeline network to allow early production of appraisal wells − Ability to achieve longer term decline profile without the impact of flaring whilst accelerating royalties to the Northern Territory Government and Native Title Holders − Initial 40 TJ/d fully contracted to the Northern Territory Government until mid-2041 under CPI-linked gas contract(1) − Drilling of remaining three wells underway to deliver the 40 TJ/d (~39 MMcf/d) plateau (initially from five wells) − Construction of the SPCF ~54% complete − Tamboran to hold >48.5% average ownership across the initial five wells following the successful stimulation program (1) Initial 9-year term with buyer’s option to extend the GSA to mid-2041.
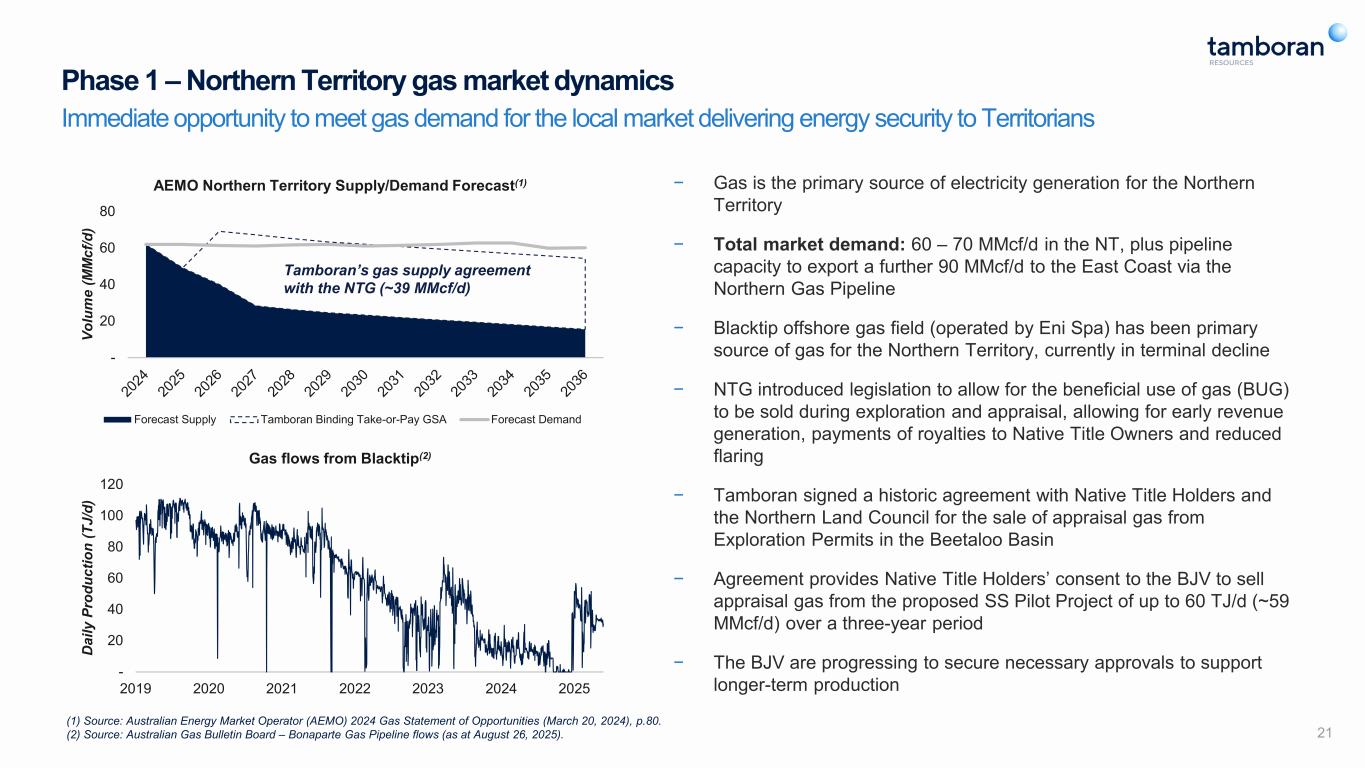
21 (1) Source: Australian Energy Market Operator (AEMO) 2024 Gas Statement of Opportunities (March 20, 2024), p.80. (2) Source: Australian Gas Bulletin Board – Bonaparte Gas Pipeline flows (as at August 26, 2025). − Gas is the primary source of electricity generation for the Northern Territory − Total market demand: 60 – 70 MMcf/d in the NT, plus pipeline capacity to export a further 90 MMcf/d to the East Coast via the Northern Gas Pipeline − Blacktip offshore gas field (operated by Eni Spa) has been primary source of gas for the Northern Territory, currently in terminal decline − NTG introduced legislation to allow for the beneficial use of gas (BUG) to be sold during exploration and appraisal, allowing for early revenue generation, payments of royalties to Native Title Owners and reduced flaring − Tamboran signed a historic agreement with Native Title Holders and the Northern Land Council for the sale of appraisal gas from Exploration Permits in the Beetaloo Basin − Agreement provides Native Title Holders’ consent to the BJV to sell appraisal gas from the proposed SS Pilot Project of up to 60 TJ/d (~59 MMcf/d) over a three-year period − The BJV are progressing to secure necessary approvals to support longer-term production Phase 1 – Northern Territory gas market dynamics Immediate opportunity to meet gas demand for the local market delivering energy security to Territorians - 20 40 60 80 Vo lu m e (M M cf /d ) AEMO Northern Territory Supply/Demand Forecast(1) Forecast Supply Tamboran Binding Take-or-Pay GSA Forecast Demand Tamboran’s gas supply agreement with the NTG (~39 MMcf/d) - 20 40 60 80 100 120 2019 2020 2021 2022 2023 2024 2025 D ai ly P ro du ct io n (T J/ d) Gas flows from Blacktip(2)
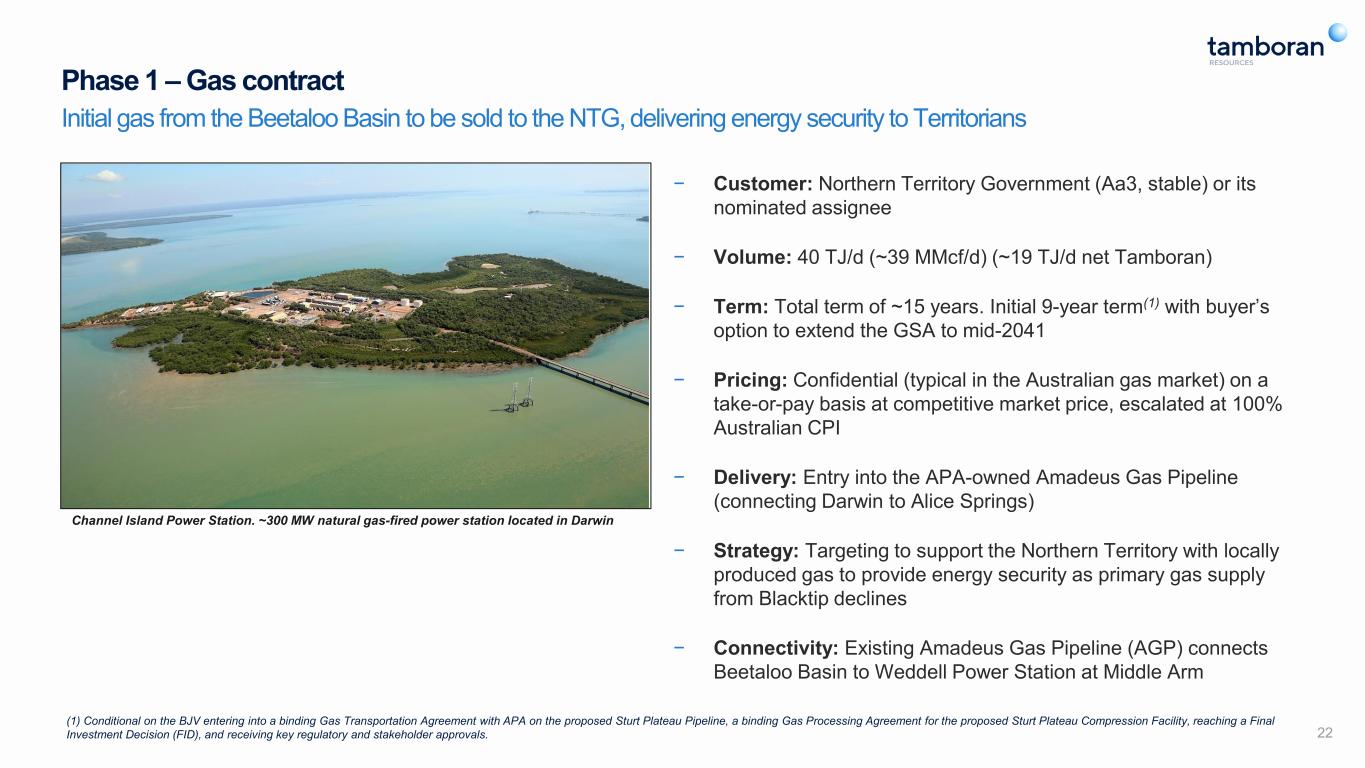
22 (1) Conditional on the BJV entering into a binding Gas Transportation Agreement with APA on the proposed Sturt Plateau Pipeline, a binding Gas Processing Agreement for the proposed Sturt Plateau Compression Facility, reaching a Final Investment Decision (FID), and receiving key regulatory and stakeholder approvals. − Customer: Northern Territory Government (Aa3, stable) or its nominated assignee − Volume: 40 TJ/d (~39 MMcf/d) (~19 TJ/d net Tamboran) − Term: Total term of ~15 years. Initial 9-year term(1) with buyer’s option to extend the GSA to mid-2041 − Pricing: Confidential (typical in the Australian gas market) on a take-or-pay basis at competitive market price, escalated at 100% Australian CPI − Delivery: Entry into the APA-owned Amadeus Gas Pipeline (connecting Darwin to Alice Springs) − Strategy: Targeting to support the Northern Territory with locally produced gas to provide energy security as primary gas supply from Blacktip declines − Connectivity: Existing Amadeus Gas Pipeline (AGP) connects Beetaloo Basin to Weddell Power Station at Middle Arm Phase 1 – Gas contract Initial gas from the Beetaloo Basin to be sold to the NTG, delivering energy security to Territorians Channel Island Power Station. ~300 MW natural gas-fired power station located in Darwin
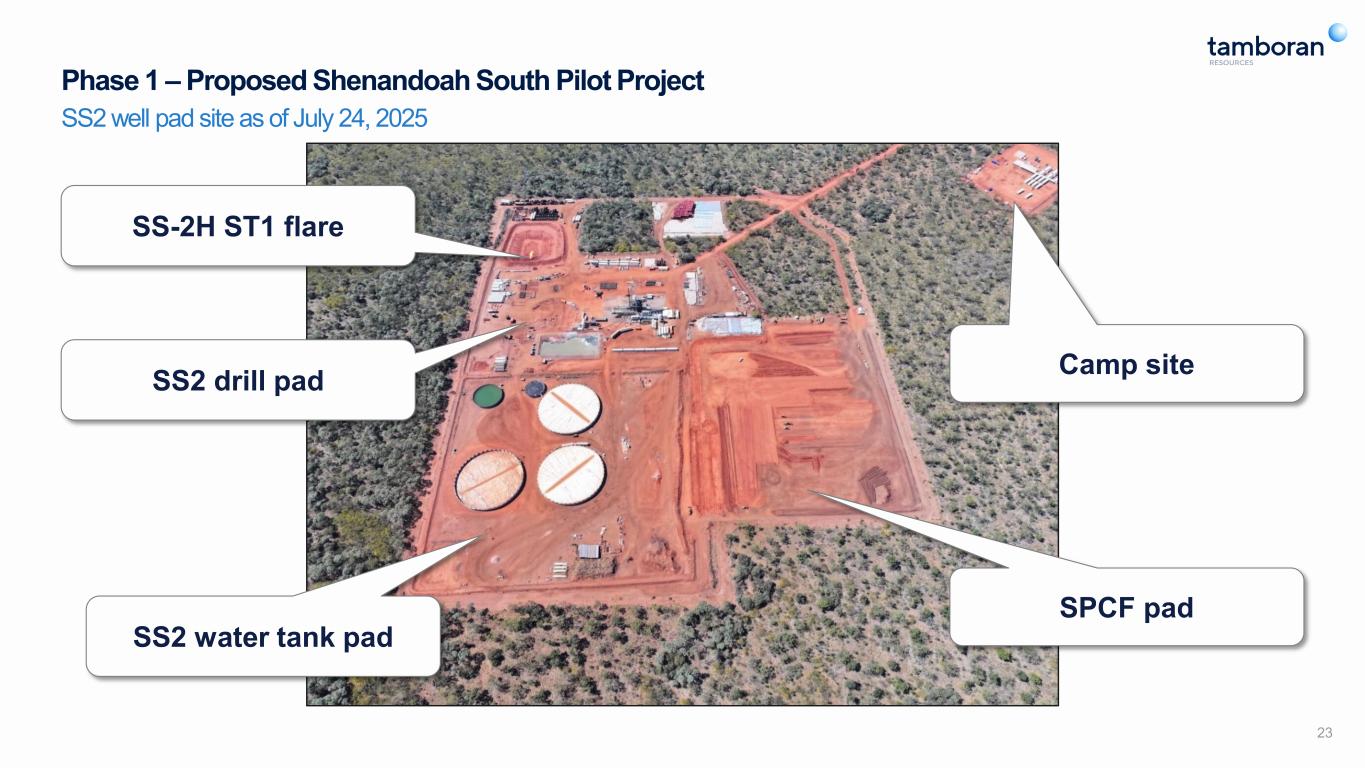
Phase 1 – Proposed Shenandoah South Pilot Project 23 SS2 well pad site as of July 24, 2025 SS2 water tank pad SPCF pad SS2 drill pad Camp site SS-2H ST1 flare
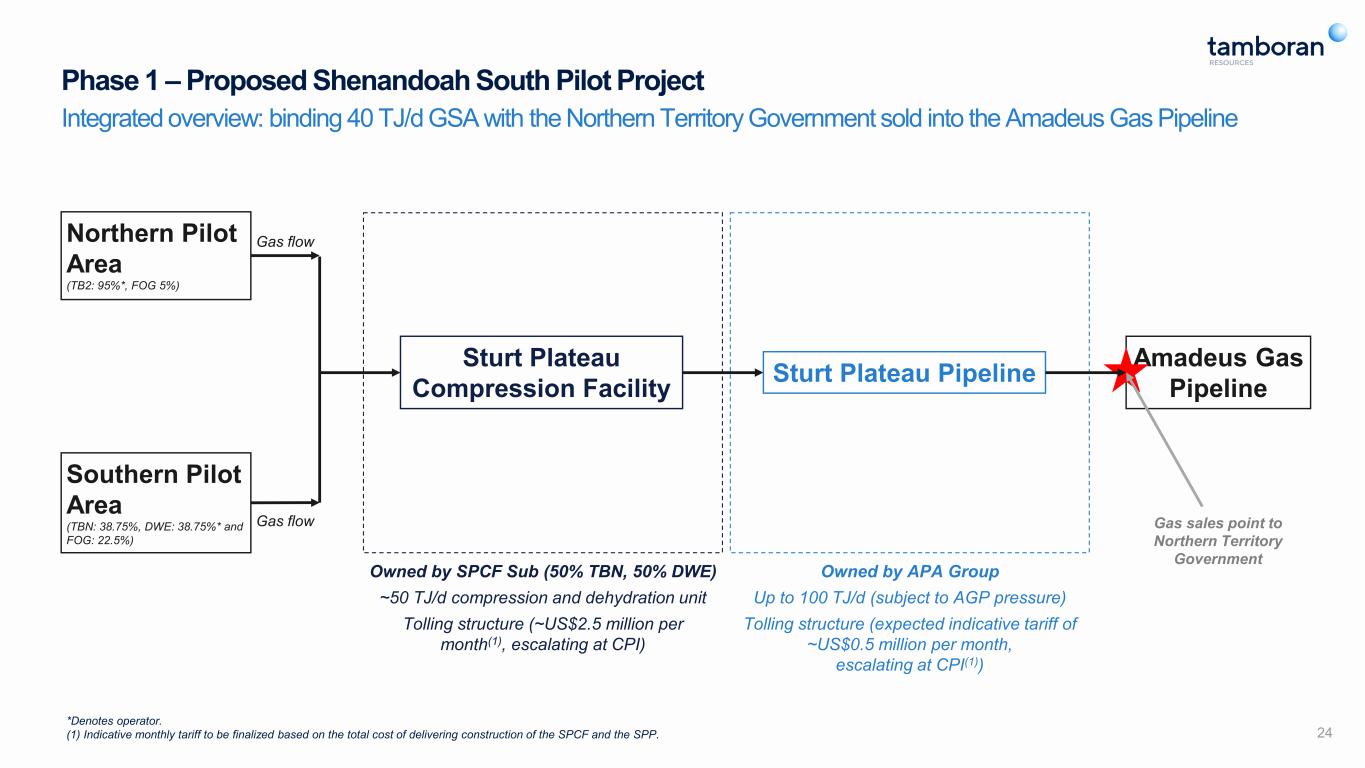
Phase 1 – Proposed Shenandoah South Pilot Project 24 Integrated overview: binding 40 TJ/d GSA with the Northern Territory Government sold into the Amadeus Gas Pipeline Northern Pilot Area (TB2: 95%*, FOG 5%) Southern Pilot Area (TBN: 38.75%, DWE: 38.75%* and FOG: 22.5%) Gas flow Gas flow Sturt Plateau Compression Facility Owned by SPCF Sub (50% TBN, 50% DWE) ~50 TJ/d compression and dehydration unit Tolling structure (~US$2.5 million per month(1), escalating at CPI) Sturt Plateau Pipeline Owned by APA Group Up to 100 TJ/d (subject to AGP pressure) Tolling structure (expected indicative tariff of ~US$0.5 million per month, escalating at CPI(1)) Amadeus Gas Pipeline Gas sales point to Northern Territory Government *Denotes operator. (1) Indicative monthly tariff to be finalized based on the total cost of delivering construction of the SPCF and the SPP.
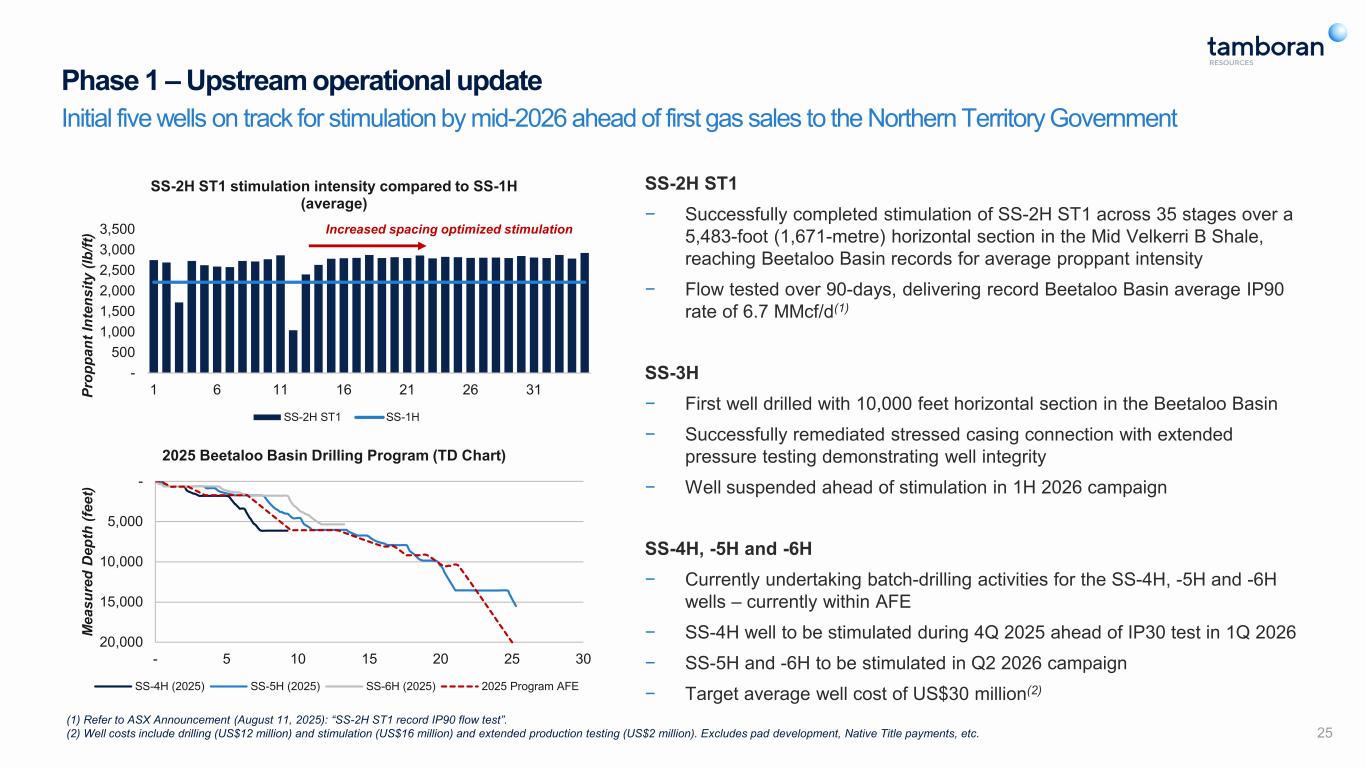
Phase 1 – Upstream operational update Initial five wells on track for stimulation by mid-2026 ahead of first gas sales to the Northern Territory Government SS-2H ST1 − Successfully completed stimulation of SS-2H ST1 across 35 stages over a 5,483-foot (1,671-metre) horizontal section in the Mid Velkerri B Shale, reaching Beetaloo Basin records for average proppant intensity − Flow tested over 90-days, delivering record Beetaloo Basin average IP90 rate of 6.7 MMcf/d(1) SS-3H − First well drilled with 10,000 feet horizontal section in the Beetaloo Basin − Successfully remediated stressed casing connection with extended pressure testing demonstrating well integrity − Well suspended ahead of stimulation in 1H 2026 campaign SS-4H, -5H and -6H − Currently undertaking batch-drilling activities for the SS-4H, -5H and -6H wells – currently within AFE − SS-4H well to be stimulated during 4Q 2025 ahead of IP30 test in 1Q 2026 − SS-5H and -6H to be stimulated in Q2 2026 campaign − Target average well cost of US$30 million(2) 25 - 5,000 10,000 15,000 20,000 - 5 10 15 20 25 30 M ea su re d D ep th (f ee t) 2025 Beetaloo Basin Drilling Program (TD Chart) SS-4H (2025) SS-5H (2025) SS-6H (2025) 2025 Program AFE - 500 1,000 1,500 2,000 2,500 3,000 3,500 1 6 11 16 21 26 31Pr op pa nt In te ns ity (l b/ ft) SS-2H ST1 stimulation intensity compared to SS-1H (average) SS-2H ST1 SS-1H Increased spacing optimized stimulation (1) Refer to ASX Announcement (August 11, 2025): “SS-2H ST1 record IP90 flow test”. (2) Well costs include drilling (US$12 million) and stimulation (US$16 million) and extended production testing (US$2 million). Excludes pad development, Native Title payments, etc.
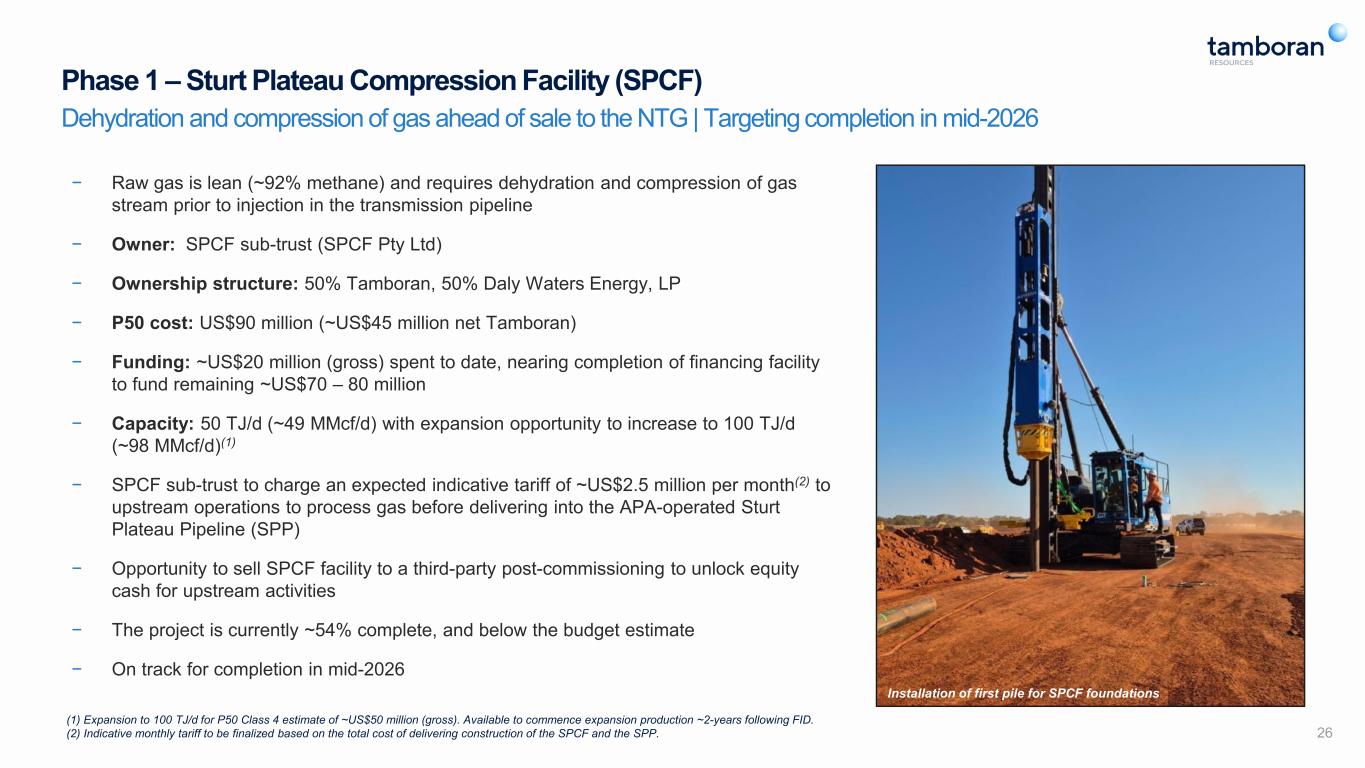
Phase 1 – Sturt Plateau Compression Facility (SPCF) Dehydration and compression of gas ahead of sale to the NTG | Targeting completion in mid-2026 26 − Raw gas is lean (~92% methane) and requires dehydration and compression of gas stream prior to injection in the transmission pipeline − Owner: SPCF sub-trust (SPCF Pty Ltd) − Ownership structure: 50% Tamboran, 50% Daly Waters Energy, LP − P50 cost: US$90 million (~US$45 million net Tamboran) − Funding: ~US$20 million (gross) spent to date, nearing completion of financing facility to fund remaining ~US$70 – 80 million − Capacity: 50 TJ/d (~49 MMcf/d) with expansion opportunity to increase to 100 TJ/d (~98 MMcf/d)(1) − SPCF sub-trust to charge an expected indicative tariff of ~US$2.5 million per month(2) to upstream operations to process gas before delivering into the APA-operated Sturt Plateau Pipeline (SPP) − Opportunity to sell SPCF facility to a third-party post-commissioning to unlock equity cash for upstream activities − The project is currently ~54% complete, and below the budget estimate − On track for completion in mid-2026 Installation of first pile for SPCF foundations (1) Expansion to 100 TJ/d for P50 Class 4 estimate of ~US$50 million (gross). Available to commence expansion production ~2-years following FID. (2) Indicative monthly tariff to be finalized based on the total cost of delivering construction of the SPCF and the SPP.
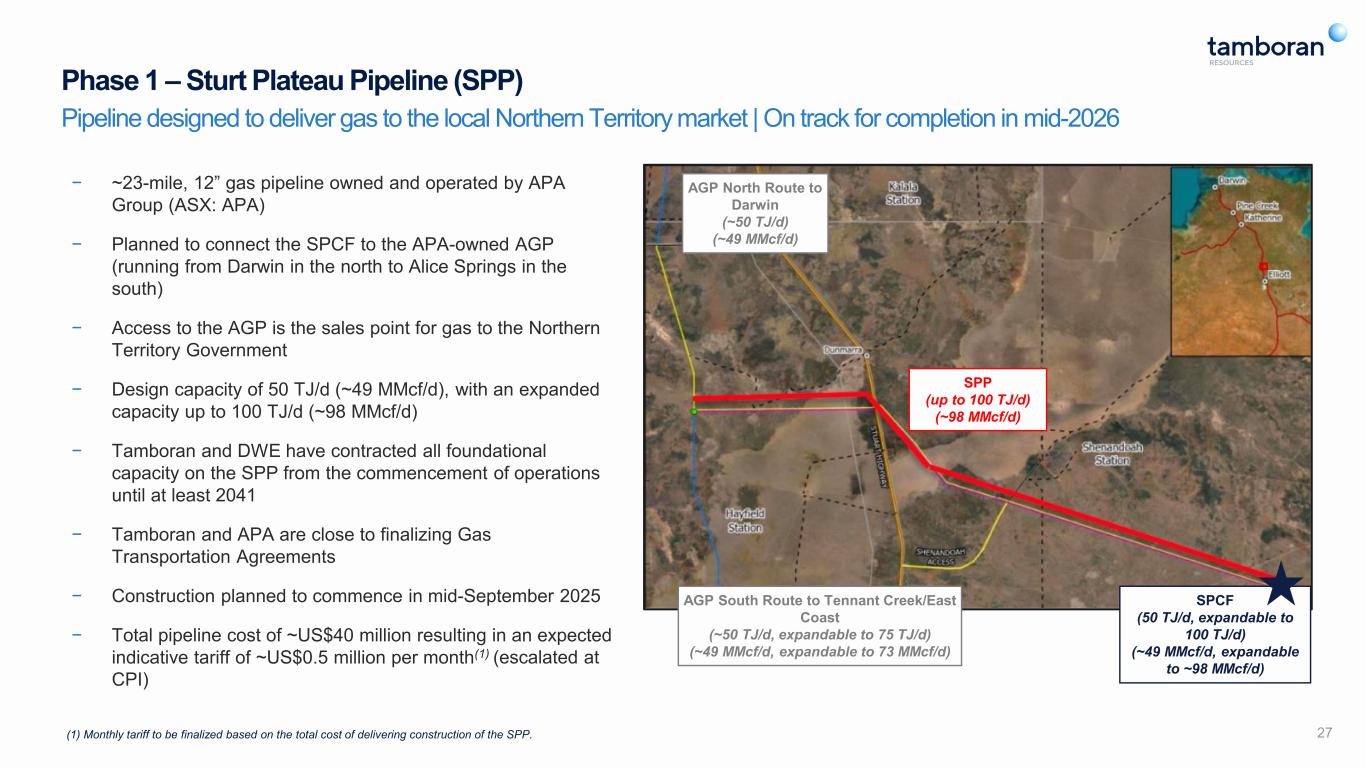
Phase 1 – Sturt Plateau Pipeline (SPP) Pipeline designed to deliver gas to the local Northern Territory market | On track for completion in mid-2026 27 − ~23-mile, 12” gas pipeline owned and operated by APA Group (ASX: APA) − Planned to connect the SPCF to the APA-owned AGP (running from Darwin in the north to Alice Springs in the south) − Access to the AGP is the sales point for gas to the Northern Territory Government − Design capacity of 50 TJ/d (~49 MMcf/d), with an expanded capacity up to 100 TJ/d (~98 MMcf/d) − Tamboran and DWE have contracted all foundational capacity on the SPP from the commencement of operations until at least 2041 − Tamboran and APA are close to finalizing Gas Transportation Agreements − Construction planned to commence in mid-September 2025 − Total pipeline cost of ~US$40 million resulting in an expected indicative tariff of ~US$0.5 million per month(1) (escalated at CPI) (1) Monthly tariff to be finalized based on the total cost of delivering construction of the SPP. SPP (up to 100 TJ/d) (~98 MMcf/d) SPCF (50 TJ/d, expandable to 100 TJ/d) (~49 MMcf/d, expandable to ~98 MMcf/d) AGP North Route to Darwin (~50 TJ/d) (~49 MMcf/d) AGP South Route to Tennant Creek/East Coast (~50 TJ/d, expandable to 75 TJ/d) (~49 MMcf/d, expandable to 73 MMcf/d)
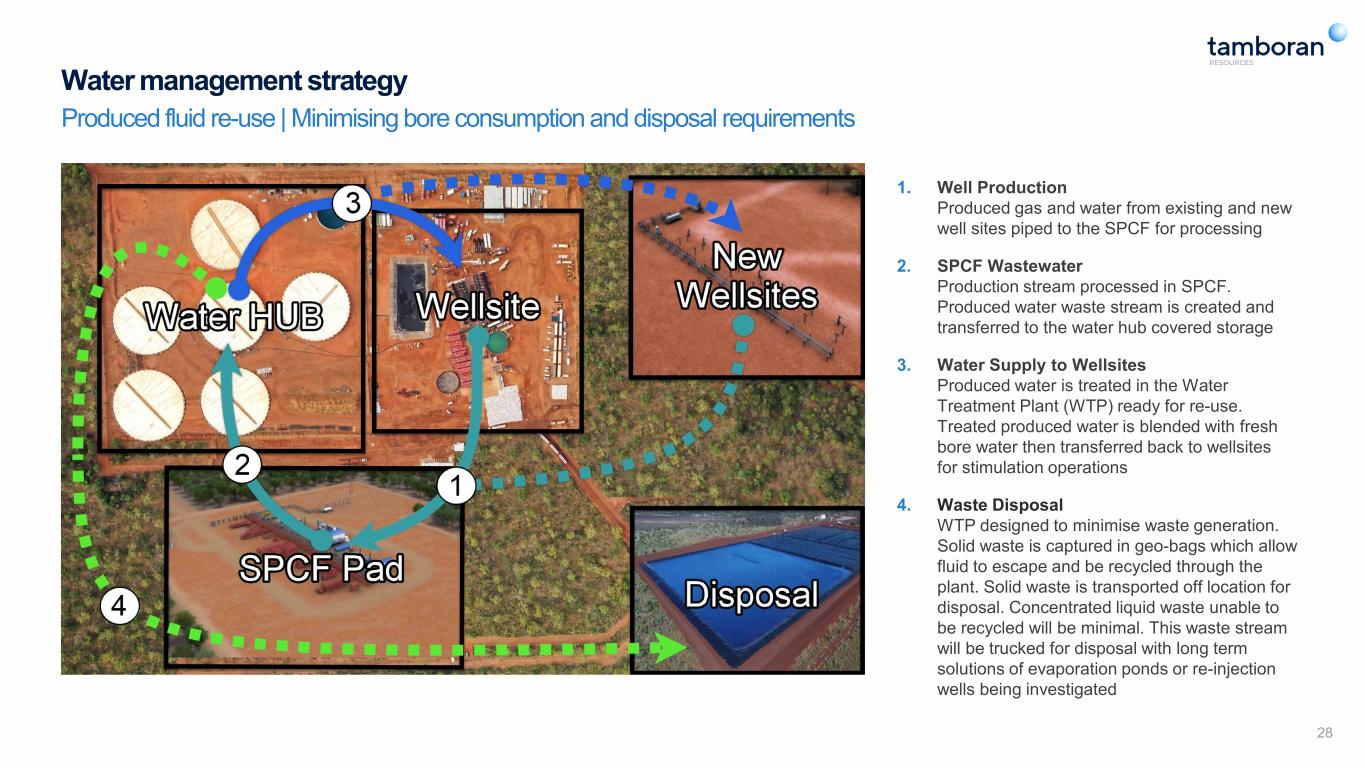
28 1. Well Production Produced gas and water from existing and new well sites piped to the SPCF for processing 2. SPCF Wastewater Production stream processed in SPCF. Produced water waste stream is created and transferred to the water hub covered storage 3. Water Supply to Wellsites Produced water is treated in the Water Treatment Plant (WTP) ready for re-use. Treated produced water is blended with fresh bore water then transferred back to wellsites for stimulation operations 4. Waste Disposal WTP designed to minimise waste generation. Solid waste is captured in geo-bags which allow fluid to escape and be recycled through the plant. Solid waste is transported off location for disposal. Concentrated liquid waste unable to be recycled will be minimal. This waste stream will be trucked for disposal with long term solutions of evaporation ponds or re-injection wells being investigated Water management strategy Produced fluid re-use | Minimising bore consumption and disposal requirements

Future market opportunities
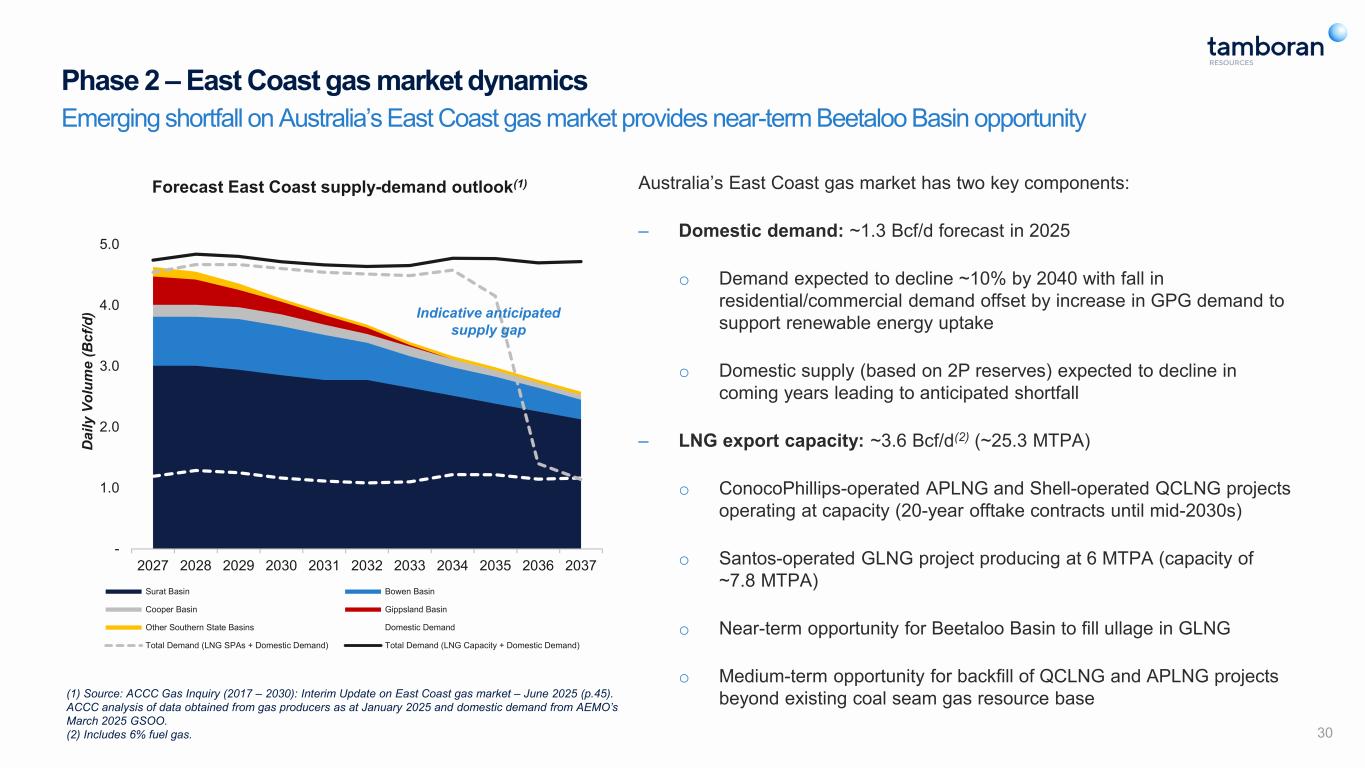
- 1.0 2.0 3.0 4.0 5.0 2027 2028 2029 2030 2031 2032 2033 2034 2035 2036 2037 D ai ly V ol um e (B cf /d ) Forecast East Coast supply-demand outlook(1) Surat Basin Bowen Basin Cooper Basin Gippsland Basin Other Southern State Basins Domestic Demand Total Demand (LNG SPAs + Domestic Demand) Total Demand (LNG Capacity + Domestic Demand) 30 (1) Source: ACCC Gas Inquiry (2017 – 2030): Interim Update on East Coast gas market – June 2025 (p.45). ACCC analysis of data obtained from gas producers as at January 2025 and domestic demand from AEMO’s March 2025 GSOO. (2) Includes 6% fuel gas. Phase 2 – East Coast gas market dynamics Emerging shortfall on Australia’s East Coast gas market provides near-term Beetaloo Basin opportunity Indicative anticipated supply gap Australia’s East Coast gas market has two key components: ‒ Domestic demand: ~1.3 Bcf/d forecast in 2025 o Demand expected to decline ~10% by 2040 with fall in residential/commercial demand offset by increase in GPG demand to support renewable energy uptake o Domestic supply (based on 2P reserves) expected to decline in coming years leading to anticipated shortfall ‒ LNG export capacity: ~3.6 Bcf/d(2) (~25.3 MTPA) o ConocoPhillips-operated APLNG and Shell-operated QCLNG projects operating at capacity (20-year offtake contracts until mid-2030s) o Santos-operated GLNG project producing at 6 MTPA (capacity of ~7.8 MTPA) o Near-term opportunity for Beetaloo Basin to fill ullage in GLNG o Medium-term opportunity for backfill of QCLNG and APLNG projects beyond existing coal seam gas resource base
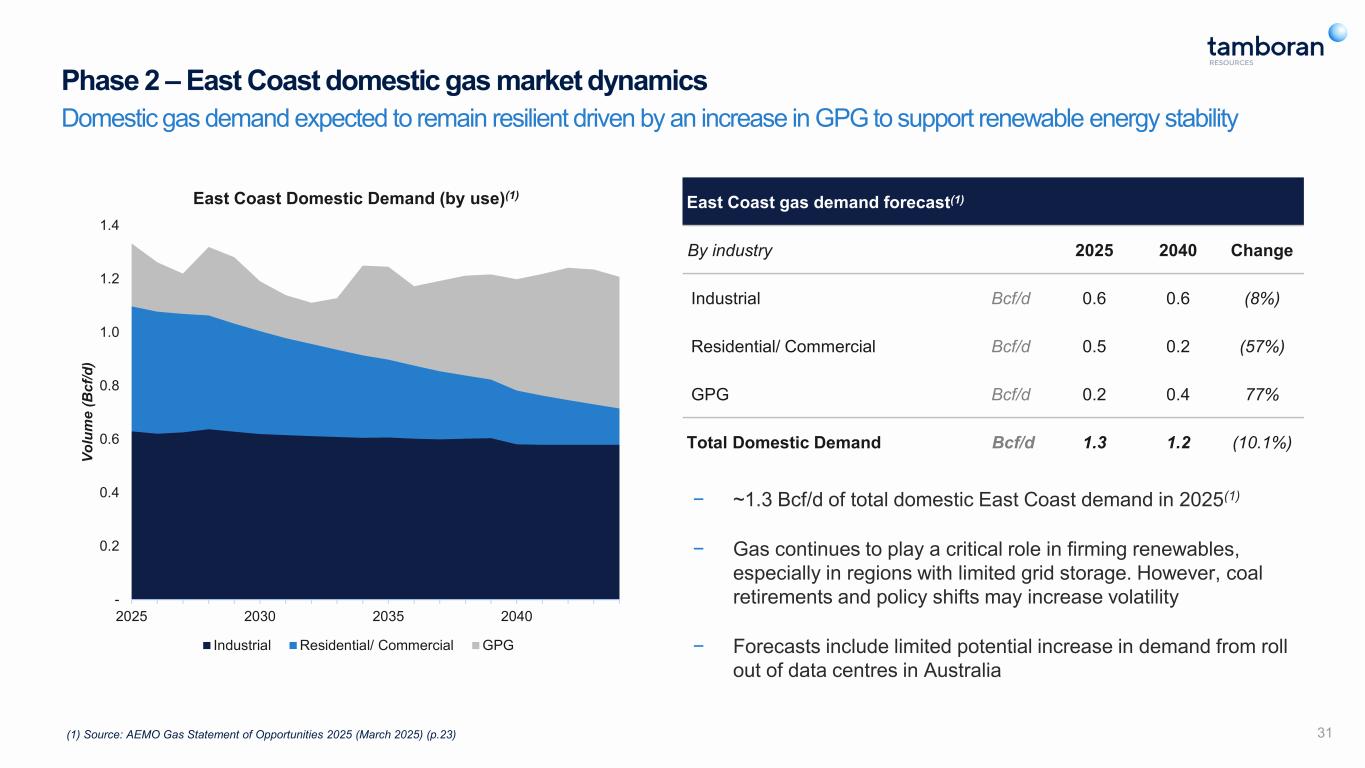
31 Phase 2 – East Coast domestic gas market dynamics Domestic gas demand expected to remain resilient driven by an increase in GPG to support renewable energy stability - 0.2 0.4 0.6 0.8 1.0 1.2 1.4 2025 2030 2035 2040 Vo lu m e (B cf /d ) East Coast Domestic Demand (by use)(1) Industrial Residential/ Commercial GPG East Coast gas demand forecast(1) By industry 2025 2040 Change Industrial Bcf/d 0.6 0.6 (8%) Residential/ Commercial Bcf/d 0.5 0.2 (57%) GPG Bcf/d 0.2 0.4 77% Total Domestic Demand Bcf/d 1.3 1.2 (10.1%) (1) Source: AEMO Gas Statement of Opportunities 2025 (March 2025) (p.23) − ~1.3 Bcf/d of total domestic East Coast demand in 2025(1) − Gas continues to play a critical role in firming renewables, especially in regions with limited grid storage. However, coal retirements and policy shifts may increase volatility − Forecasts include limited potential increase in demand from roll out of data centres in Australia
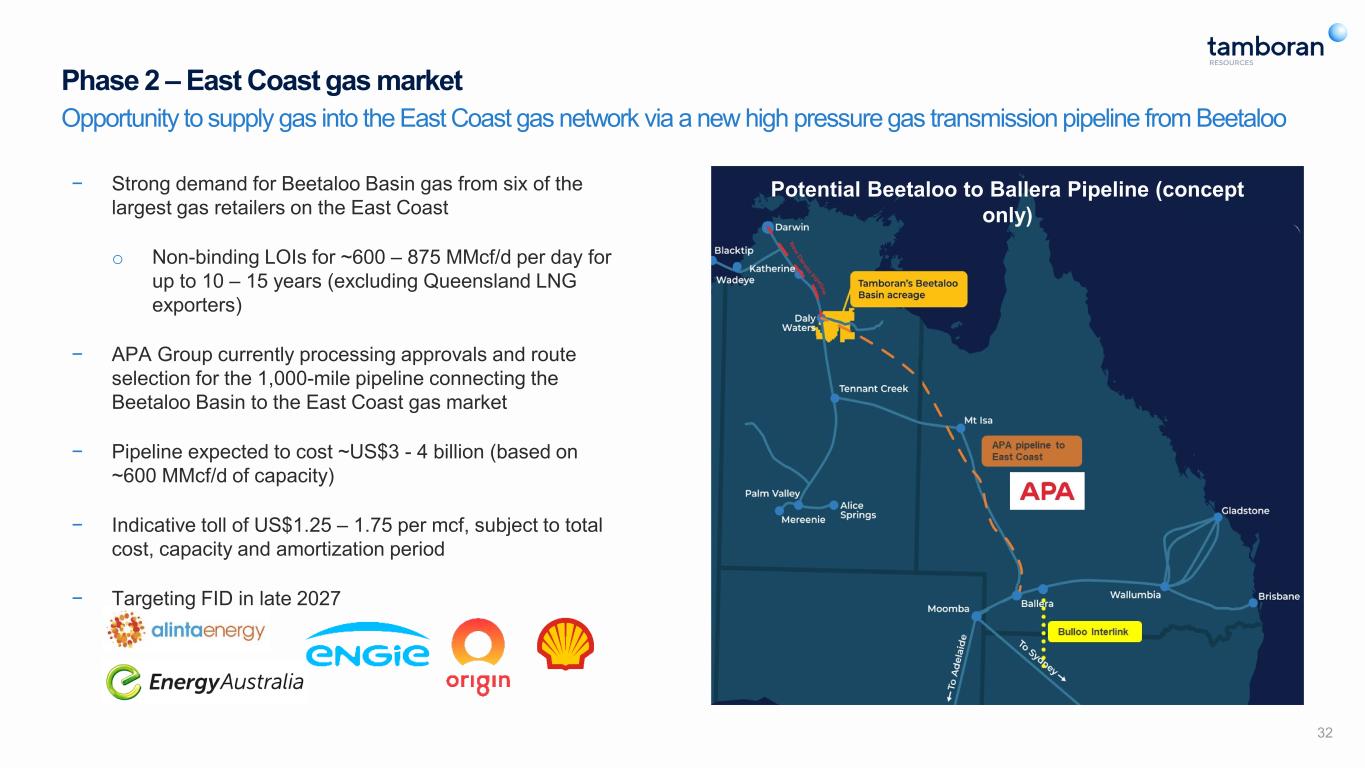
32 Opportunity to supply gas into the East Coast gas network via a new high pressure gas transmission pipeline from Beetaloo Phase 2 – East Coast gas market − Strong demand for Beetaloo Basin gas from six of the largest gas retailers on the East Coast o Non-binding LOIs for ~600 – 875 MMcf/d per day for up to 10 – 15 years (excluding Queensland LNG exporters) − APA Group currently processing approvals and route selection for the 1,000-mile pipeline connecting the Beetaloo Basin to the East Coast gas market − Pipeline expected to cost ~US$3 - 4 billion (based on ~600 MMcf/d of capacity) − Indicative toll of US$1.25 – 1.75 per mcf, subject to total cost, capacity and amortization period − Targeting FID in late 2027 Potential Beetaloo to Ballera Pipeline (concept only)
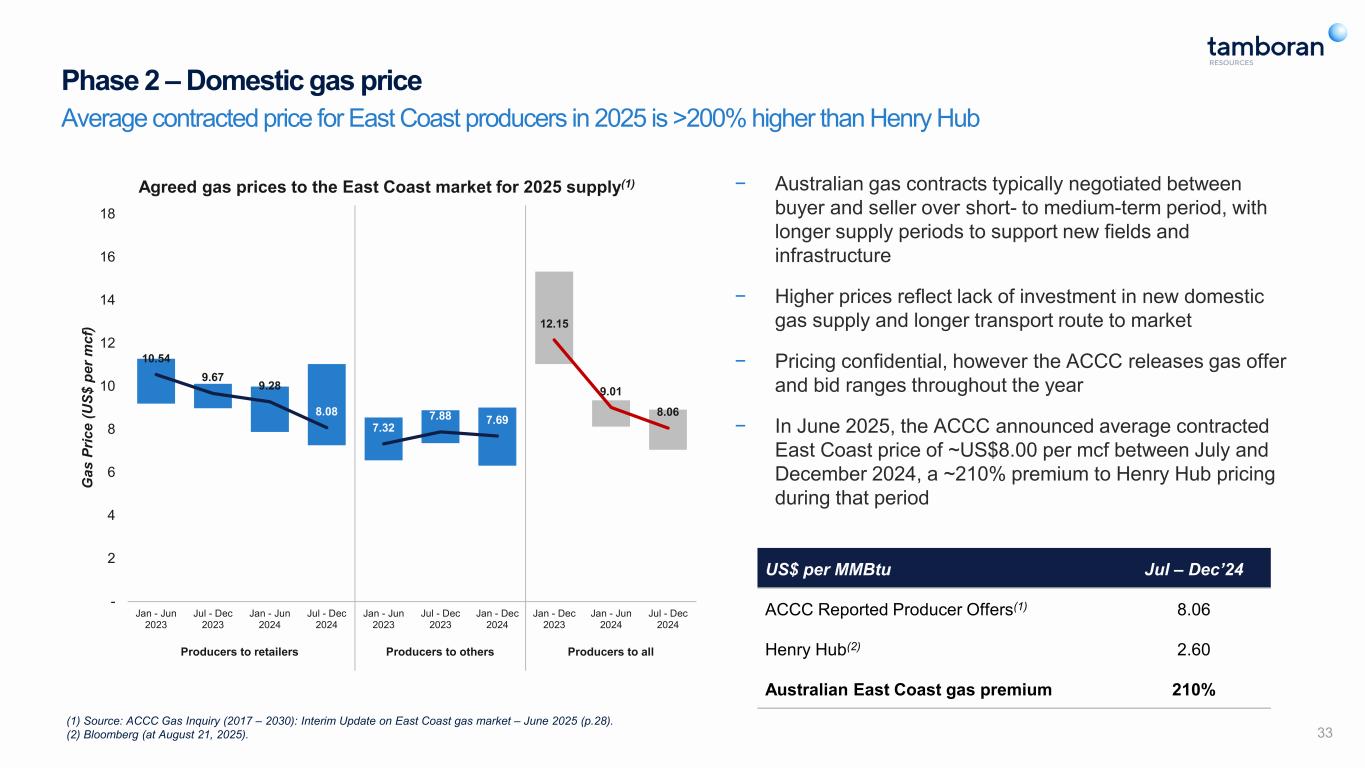
33 Phase 2 – Domestic gas price Average contracted price for East Coast producers in 2025 is >200% higher than Henry Hub − Australian gas contracts typically negotiated between buyer and seller over short- to medium-term period, with longer supply periods to support new fields and infrastructure − Higher prices reflect lack of investment in new domestic gas supply and longer transport route to market − Pricing confidential, however the ACCC releases gas offer and bid ranges throughout the year − In June 2025, the ACCC announced average contracted East Coast price of ~US$8.00 per mcf between July and December 2024, a ~210% premium to Henry Hub pricing during that period 10.54 9.67 9.28 8.08 7.32 7.88 7.69 12.15 9.01 8.06 - 2 4 6 8 10 12 14 16 18 Jan - Jun 2023 Jul - Dec 2023 Jan - Jun 2024 Jul - Dec 2024 Jan - Jun 2023 Jul - Dec 2023 Jan - Dec 2024 Jan - Dec 2023 Jan - Jun 2024 Jul - Dec 2024 G as P ric e (U S$ p er m cf ) Agreed gas prices to the East Coast market for 2025 supply(1) Producers to retailers Producers to others Producers to all US$ per MMBtu Jul – Dec’24 ACCC Reported Producer Offers(1) 8.06 Henry Hub(2) 2.60 Australian East Coast gas premium 210% (1) Source: ACCC Gas Inquiry (2017 – 2030): Interim Update on East Coast gas market – June 2025 (p.28). (2) Bloomberg (at August 21, 2025).
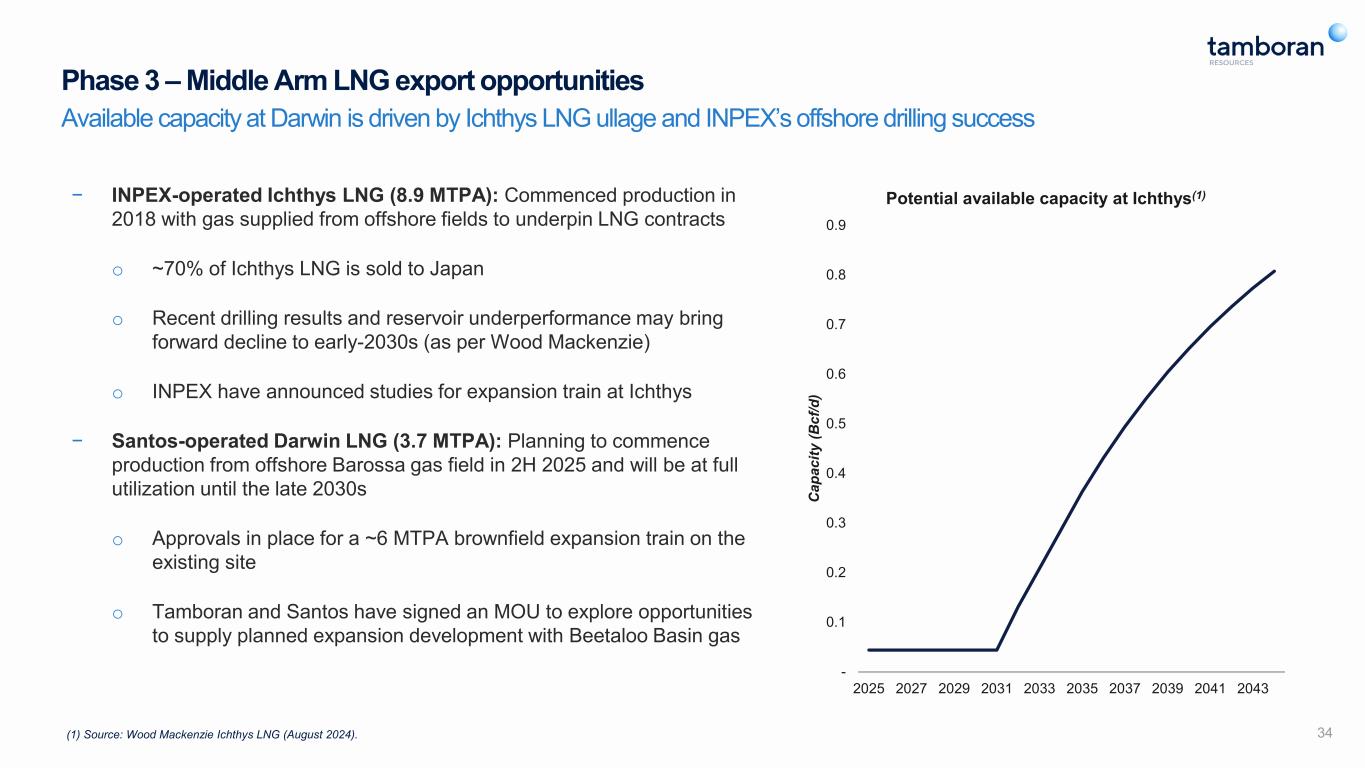
34 Phase 3 – Middle Arm LNG export opportunities Available capacity at Darwin is driven by Ichthys LNG ullage and INPEX’s offshore drilling success (1) Source: Wood Mackenzie Ichthys LNG (August 2024). − INPEX-operated Ichthys LNG (8.9 MTPA): Commenced production in 2018 with gas supplied from offshore fields to underpin LNG contracts o ~70% of Ichthys LNG is sold to Japan o Recent drilling results and reservoir underperformance may bring forward decline to early-2030s (as per Wood Mackenzie) o INPEX have announced studies for expansion train at Ichthys − Santos-operated Darwin LNG (3.7 MTPA): Planning to commence production from offshore Barossa gas field in 2H 2025 and will be at full utilization until the late 2030s o Approvals in place for a ~6 MTPA brownfield expansion train on the existing site o Tamboran and Santos have signed an MOU to explore opportunities to supply planned expansion development with Beetaloo Basin gas - 0.1 0.2 0.3 0.4 0.5 0.6 0.7 0.8 0.9 2025 2027 2029 2031 2033 2035 2037 2039 2041 2043 C ap ac ity (B cf /d ) Potential available capacity at Ichthys(1)
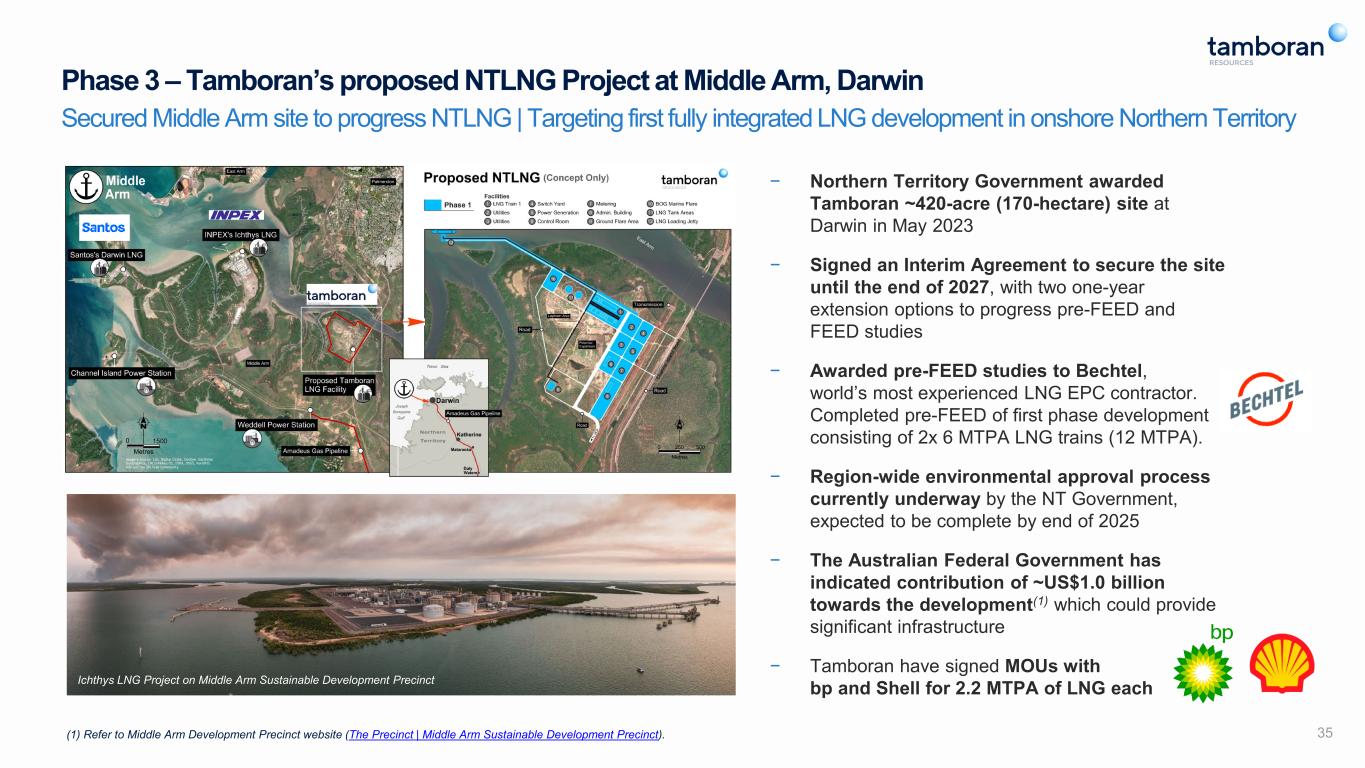
35 − Northern Territory Government awarded Tamboran ~420-acre (170-hectare) site at Darwin in May 2023 − Signed an Interim Agreement to secure the site until the end of 2027, with two one-year extension options to progress pre-FEED and FEED studies − Awarded pre-FEED studies to Bechtel, world’s most experienced LNG EPC contractor. Completed pre-FEED of first phase development consisting of 2x 6 MTPA LNG trains (12 MTPA). − Region-wide environmental approval process currently underway by the NT Government, expected to be complete by end of 2025 − The Australian Federal Government has indicated contribution of ~US$1.0 billion towards the development(1) which could provide significant infrastructure − Tamboran have signed MOUs with bp and Shell for 2.2 MTPA of LNG each (1) Refer to Middle Arm Development Precinct website (The Precinct | Middle Arm Sustainable Development Precinct). Secured Middle Arm site to progress NTLNG | Targeting first fully integrated LNG development in onshore Northern Territory Phase 3 – Tamboran’s proposed NTLNG Project at Middle Arm, Darwin Ichthys LNG Project on Middle Arm Sustainable Development Precinct
Cost reduction and value-add initiatives
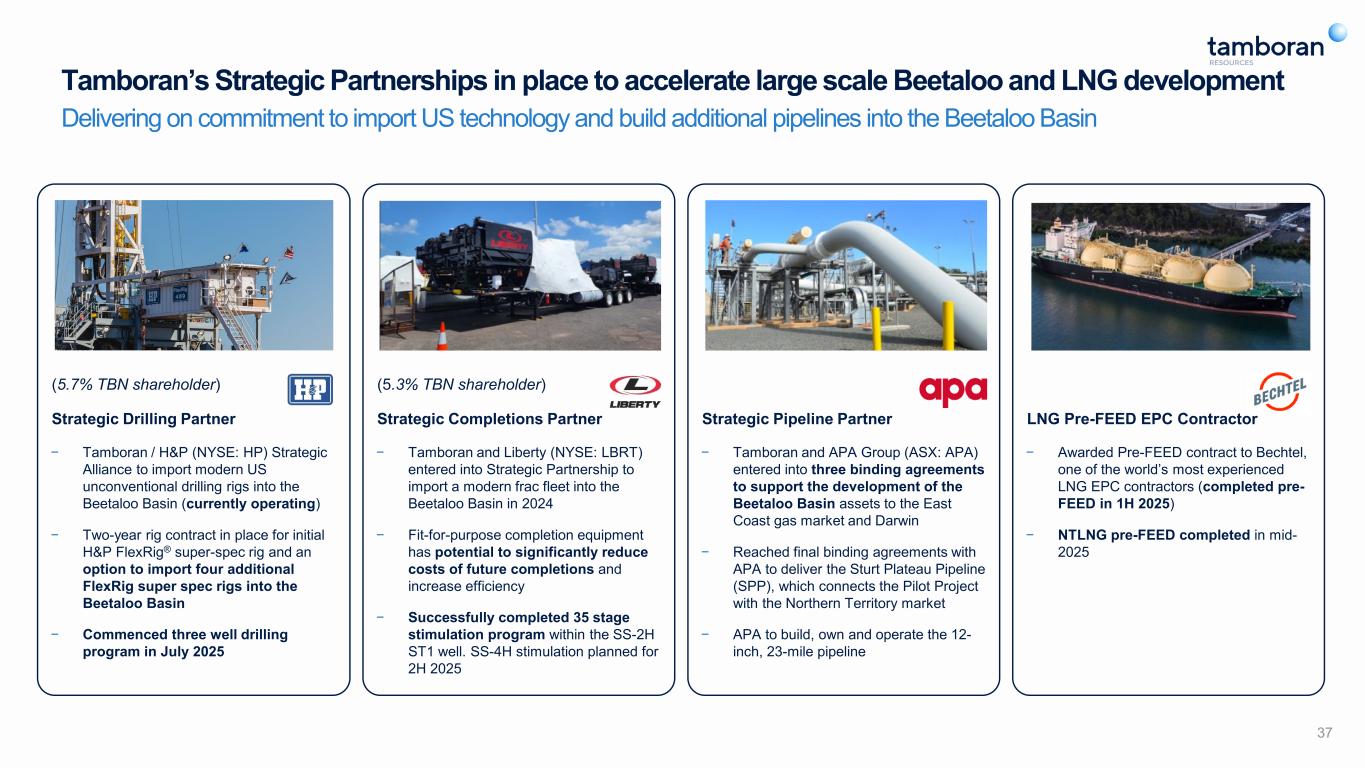
Tamboran’s Strategic Partnerships in place to accelerate large scale Beetaloo and LNG development Delivering on commitment to import US technology and build additional pipelines into the Beetaloo Basin 37 (5.7% TBN shareholder) Strategic Drilling Partner − Tamboran / H&P (NYSE: HP) Strategic Alliance to import modern US unconventional drilling rigs into the Beetaloo Basin (currently operating) − Two-year rig contract in place for initial H&P FlexRig® super-spec rig and an option to import four additional FlexRig super spec rigs into the Beetaloo Basin − Commenced three well drilling program in July 2025 (5.3% TBN shareholder) Strategic Completions Partner − Tamboran and Liberty (NYSE: LBRT) entered into Strategic Partnership to import a modern frac fleet into the Beetaloo Basin in 2024 − Fit-for-purpose completion equipment has potential to significantly reduce costs of future completions and increase efficiency − Successfully completed 35 stage stimulation program within the SS-2H ST1 well. SS-4H stimulation planned for 2H 2025 Strategic Pipeline Partner − Tamboran and APA Group (ASX: APA) entered into three binding agreements to support the development of the Beetaloo Basin assets to the East Coast gas market and Darwin − Reached final binding agreements with APA to deliver the Sturt Plateau Pipeline (SPP), which connects the Pilot Project with the Northern Territory market − APA to build, own and operate the 12- inch, 23-mile pipeline LNG Pre-FEED EPC Contractor − Awarded Pre-FEED contract to Bechtel, one of the world’s most experienced LNG EPC contractors (completed pre- FEED in 1H 2025) − NTLNG pre-FEED completed in mid- 2025
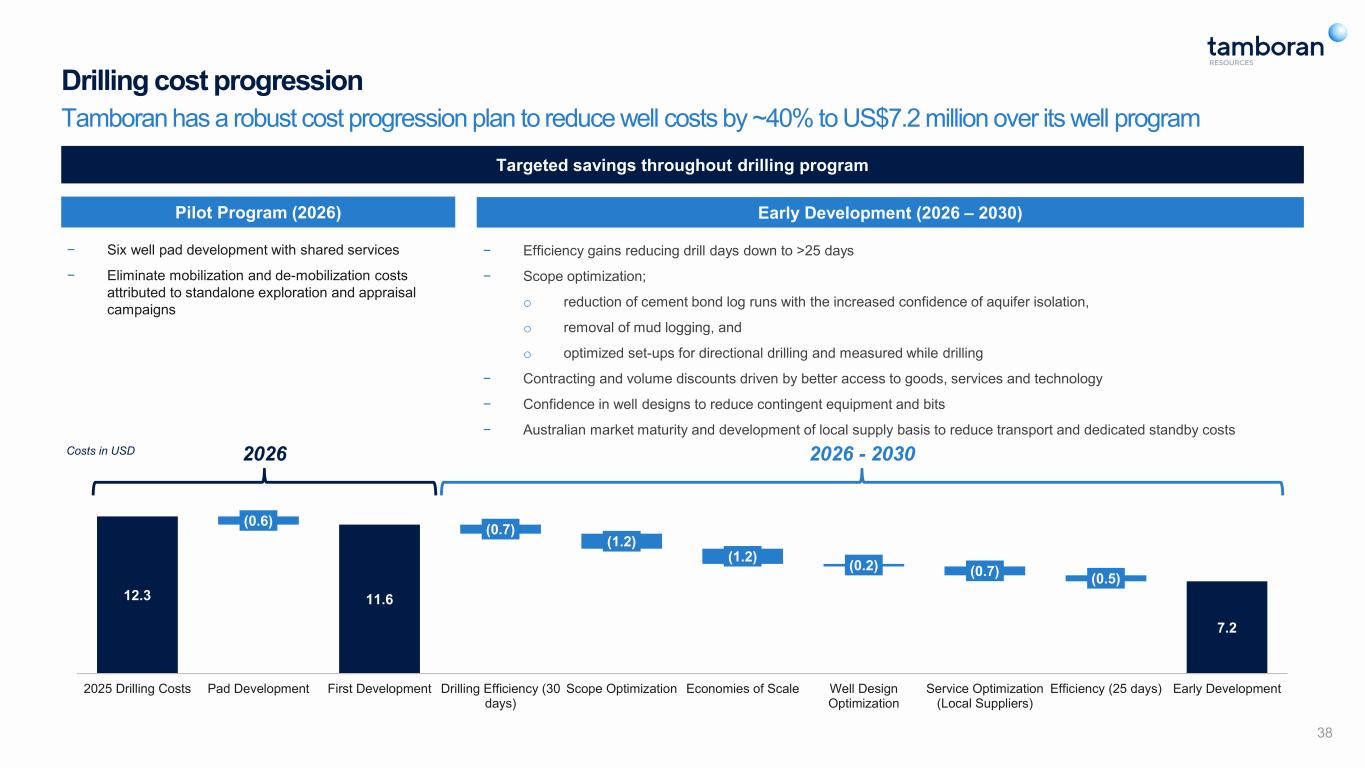
11.6 7.2 (0.6) (0.7) (1.2) (1.2) (0.2) (0.7) (0.5) 12.3 2025 Drilling Costs Pad Development First Development Drilling Efficiency (30 days) Scope Optimization Economies of Scale Well Design Optimization Service Optimization (Local Suppliers) Efficiency (25 days) Early Development Drilling cost progression Tamboran has a robust cost progression plan to reduce well costs by ~40% to US$7.2 million over its well program Pilot Program (2026) − Six well pad development with shared services − Eliminate mobilization and de-mobilization costs attributed to standalone exploration and appraisal campaigns Early Development (2026 – 2030) − Efficiency gains reducing drill days down to >25 days − Scope optimization; o reduction of cement bond log runs with the increased confidence of aquifer isolation, o removal of mud logging, and o optimized set-ups for directional drilling and measured while drilling − Contracting and volume discounts driven by better access to goods, services and technology − Confidence in well designs to reduce contingent equipment and bits − Australian market maturity and development of local supply basis to reduce transport and dedicated standby costs Targeted savings throughout drilling program 2026 2026 - 2030 38 Costs in USD
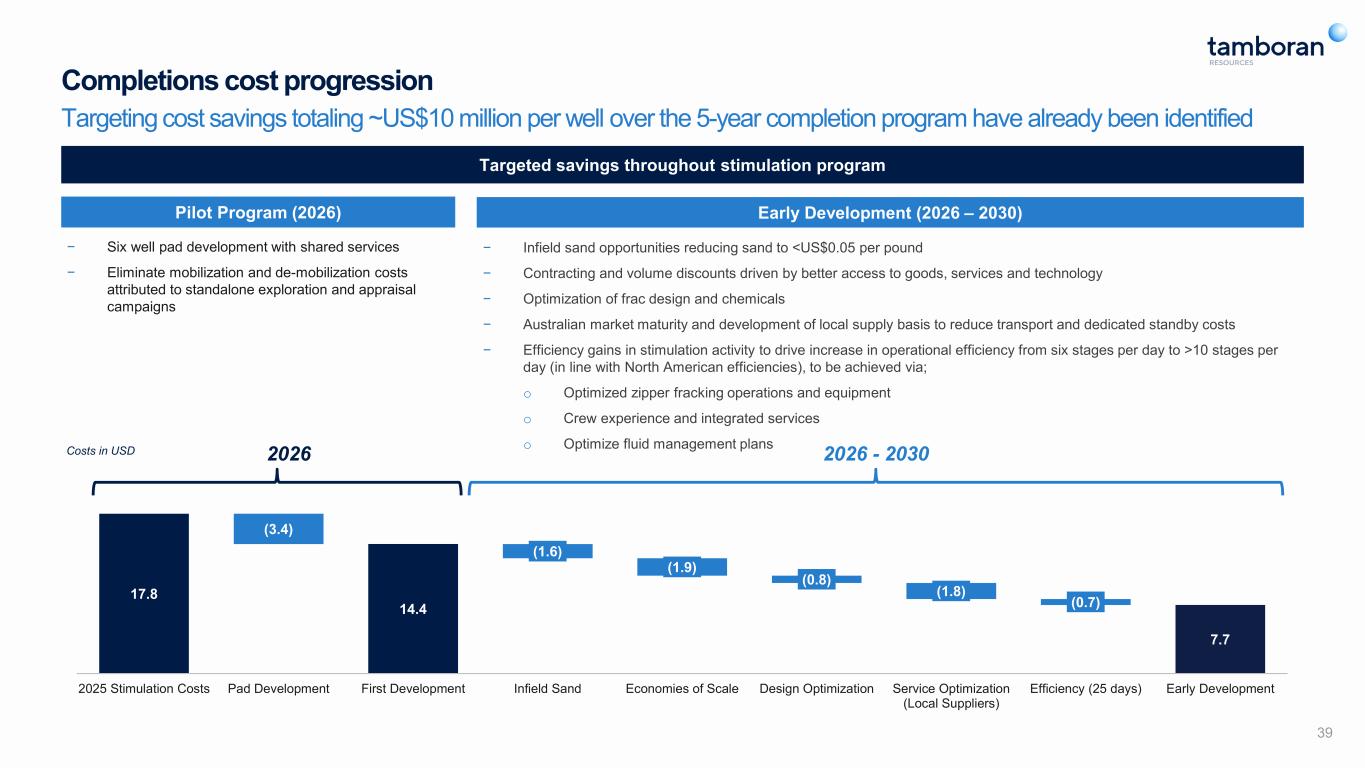
14.4 7.7 (3.4) (1.6) (1.9) (0.8) (1.8) (0.7)17.8 2025 Stimulation Costs Pad Development First Development Infield Sand Economies of Scale Design Optimization Service Optimization (Local Suppliers) Efficiency (25 days) Early Development Completions cost progression Targeting cost savings totaling ~US$10 million per well over the 5-year completion program have already been identified Pilot Program (2026) − Six well pad development with shared services − Eliminate mobilization and de-mobilization costs attributed to standalone exploration and appraisal campaigns Early Development (2026 – 2030) − Infield sand opportunities reducing sand to <US$0.05 per pound − Contracting and volume discounts driven by better access to goods, services and technology − Optimization of frac design and chemicals − Australian market maturity and development of local supply basis to reduce transport and dedicated standby costs − Efficiency gains in stimulation activity to drive increase in operational efficiency from six stages per day to >10 stages per day (in line with North American efficiencies), to be achieved via; o Optimized zipper fracking operations and equipment o Crew experience and integrated services o Optimize fluid management plans Targeted savings throughout stimulation program 2026 2026 - 2030 39 Costs in USD
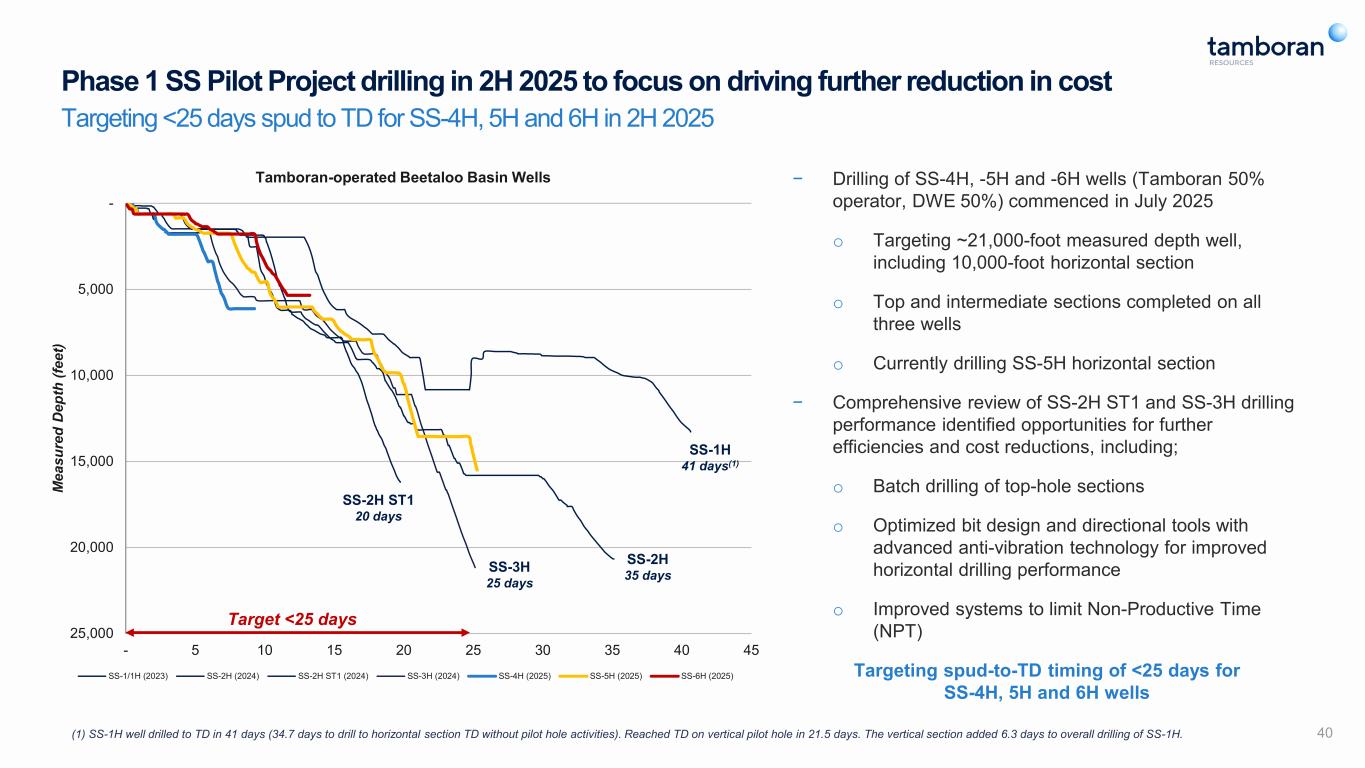
40 Phase 1 SS Pilot Project drilling in 2H 2025 to focus on driving further reduction in cost Targeting <25 days spud to TD for SS-4H, 5H and 6H in 2H 2025 - 5,000 10,000 15,000 20,000 25,000 - 5 10 15 20 25 30 35 40 45 M ea su re d D ep th (f ee t) Tamboran-operated Beetaloo Basin Wells SS-1/1H (2023) SS-2H (2024) SS-2H ST1 (2024) SS-3H (2024) SS-4H (2025) SS-5H (2025) SS-6H (2025) SS-2H ST1 20 days − Drilling of SS-4H, -5H and -6H wells (Tamboran 50% operator, DWE 50%) commenced in July 2025 o Targeting ~21,000-foot measured depth well, including 10,000-foot horizontal section o Top and intermediate sections completed on all three wells o Currently drilling SS-5H horizontal section − Comprehensive review of SS-2H ST1 and SS-3H drilling performance identified opportunities for further efficiencies and cost reductions, including; o Batch drilling of top-hole sections o Optimized bit design and directional tools with advanced anti-vibration technology for improved horizontal drilling performance o Improved systems to limit Non-Productive Time (NPT) Targeting spud-to-TD timing of <25 days for SS-4H, 5H and 6H wells Target <25 days (1) SS-1H well drilled to TD in 41 days (34.7 days to drill to horizontal section TD without pilot hole activities). Reached TD on vertical pilot hole in 21.5 days. The vertical section added 6.3 days to overall drilling of SS-1H. SS-3H 25 days SS-2H 35 days SS-1H 41 days(1)
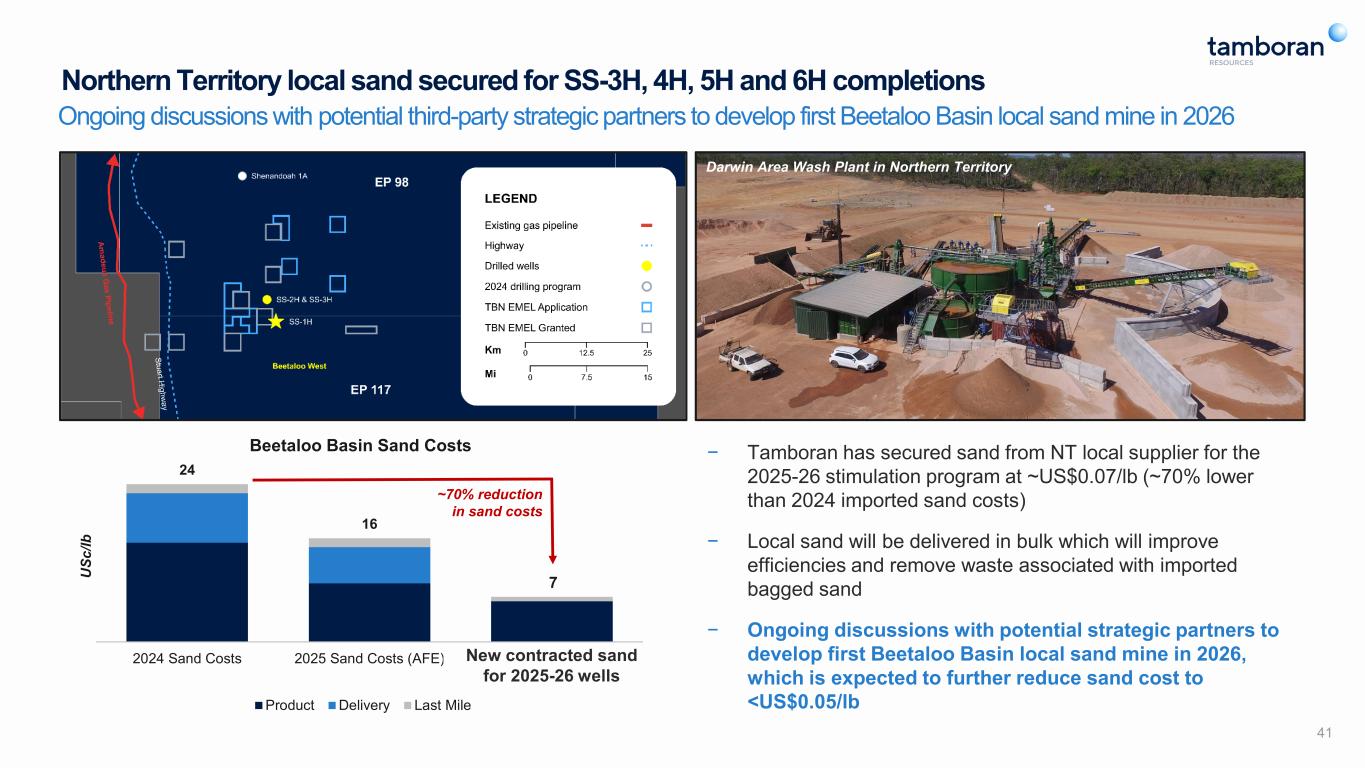
24 16 7 2024 Sand Costs 2025 Sand Costs (AFE) Potential In-field Mining and Processing U Sc /lb Beetaloo Basin Sand Costs Product Delivery Last Mile Northern Territory local sand secured for SS-3H, 4H, 5H and 6H completions Ongoing discussions with potential third-party strategic partners to develop first Beetaloo Basin local sand mine in 2026 − Tamboran has secured sand from NT local supplier for the 2025-26 stimulation program at ~US$0.07/lb (~70% lower than 2024 imported sand costs) − Local sand will be delivered in bulk which will improve efficiencies and remove waste associated with imported bagged sand − Ongoing discussions with potential strategic partners to develop first Beetaloo Basin local sand mine in 2026, which is expected to further reduce sand cost to <US$0.05/lb 41 ~70% reduction in sand costs Darwin Area Wash Plant in Northern Territory New co tracted sand for 2025-26 wells

Upcoming catalysts
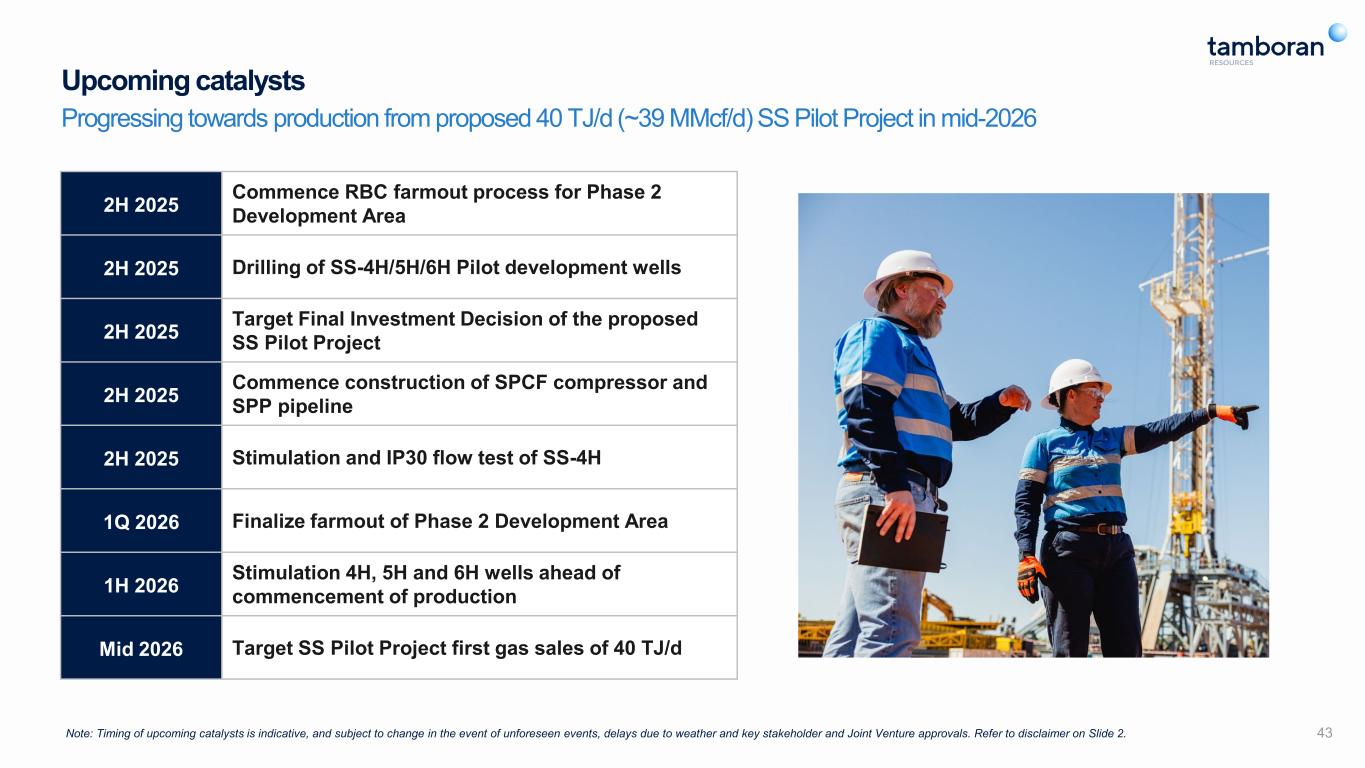
Upcoming catalysts Progressing towards production from proposed 40 TJ/d (~39 MMcf/d) SS Pilot Project in mid-2026 43Note: Timing of upcoming catalysts is indicative, and subject to change in the event of unforeseen events, delays due to weather and key stakeholder and Joint Venture approvals. Refer to disclaimer on Slide 2. 2H 2025 Commence RBC farmout process for Phase 2 Development Area 2H 2025 Drilling of SS-4H/5H/6H Pilot development wells 2H 2025 Target Final Investment Decision of the proposed SS Pilot Project 2H 2025 Commence construction of SPCF compressor and SPP pipeline 2H 2025 Stimulation and IP30 flow test of SS-4H 1Q 2026 Finalize farmout of Phase 2 Development Area 1H 2026 Stimulation 4H, 5H and 6H wells ahead of commencement of production Mid 2026 Target SS Pilot Project first gas sales of 40 TJ/d

Appendix
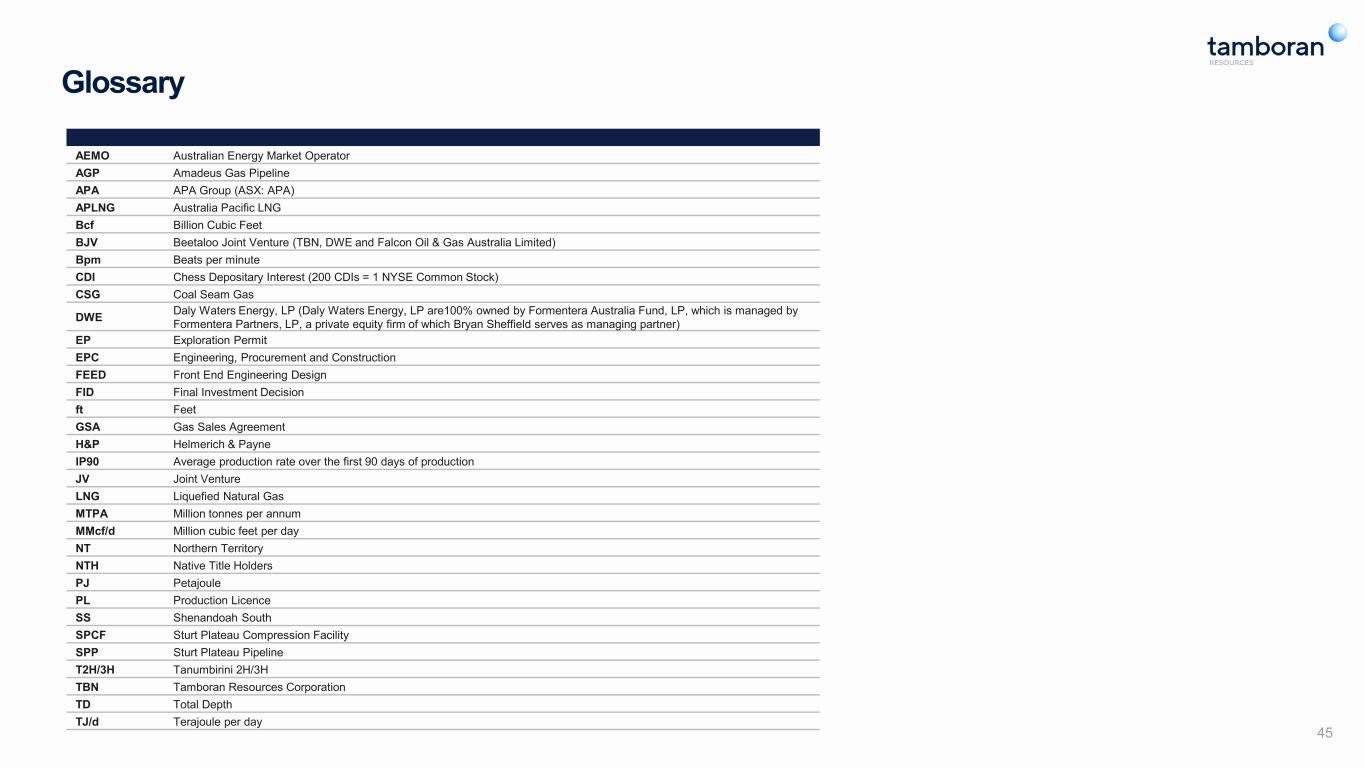
Glossary AEMO Australian Energy Market Operator AGP Amadeus Gas Pipeline APA APA Group (ASX: APA) APLNG Australia Pacific LNG Bcf Billion Cubic Feet BJV Beetaloo Joint Venture (TBN, DWE and Falcon Oil & Gas Australia Limited) Bpm Beats per minute CDI Chess Depositary Interest (200 CDIs = 1 NYSE Common Stock) CSG Coal Seam Gas DWE Daly Waters Energy, LP (Daly Waters Energy, LP are100% owned by Formentera Australia Fund, LP, which is managed by Formentera Partners, LP, a private equity firm of which Bryan Sheffield serves as managing partner) EP Exploration Permit EPC Engineering, Procurement and Construction FEED Front End Engineering Design FID Final Investment Decision ft Feet GSA Gas Sales Agreement H&P Helmerich & Payne IP90 Average production rate over the first 90 days of production JV Joint Venture LNG Liquefied Natural Gas MTPA Million tonnes per annum MMcf/d Million cubic feet per day NT Northern Territory NTH Native Title Holders PJ Petajoule PL Production Licence SS Shenandoah South SPCF Sturt Plateau Compression Facility SPP Sturt Plateau Pipeline T2H/3H Tanumbirini 2H/3H TBN Tamboran Resources Corporation TD Total Depth TJ/d Terajoule per day 45
