EX-99.1
Published on November 12, 2026
` NYSE: TBN, ASX: TBN 1Q FY27 Result Presentation Mr. Todd Abbott – Managing Director and Chief Executive Officer November 12, 2026
The information in this presentation includes “forward-looking statements” within the meaning of Section 27A of the Securities Act of 1933, as amended (the “Securities Act”), and Section 21E of the Securities Exchange Act of 1934, as amended (the “Exchange Act”), which include statements on Tamboran Resources Corporation's ("we", "us" or the "Company") opinions, expectations, beliefs, plans, objectives, assumptions or projections regarding future events or future results. All statements, other than statements of historical fact included in this presentation regarding our strategy, present and future operations, financial position, estimated revenues and losses, projected costs, estimated reserves, prospects, plans and objectives of management are forward-looking statements. When used in this presentation, words such as “may,” “assume,” “forecast,” “could,” “should,” “will,” “plan,” “believe,” “anticipate,” “intend,” “estimate,” “expect,” “project,” “budget”, "achieve," "progress," "target," "expand," "deliver“, "potential," "propose," "enter," "provide," "contribute," and similar expressions are used to identify forward-looking statements, although not all forward-looking statements contain such identifying words. These forward-looking statements are based on management’s current belief, based on currently available information, as to the outcome and timing of future events at the time such statement was made. These forward‐looking statements are not a guarantee of our performance, and you should not place undue reliance on such statements. Forward looking statements may include statements about, among other things: our business strategy and the successful implementation of our business strategy; our future reserves; our financial strategy, liquidity and capital required for our development programs; estimated natural gas prices; our dividend policy; the timing and amount of future production of natural gas; our drilling and production plans; competition and government regulation; our ability to obtain and retain permits and governmental approvals; legal, regulatory or environmental matters; marketing of natural gas; business or leasehold acquisitions and integration of acquired businesses; our ability to develop our properties; the availability and cost of developing appropriate infrastructure around and transportation to our properties; the availability and cost of drilling rigs, production equipment, supplies, personnel and oilfield services; costs of developing our properties and of conducting our operations; our ability to reach FID and execute and complete our planned pipeline or planned LNG export projects; our anticipated Scope 1, Scope 2 and Scope 3 emissions from our businesses and our plans to offset our Scope 1, Scope 2 and Scope 3 emissions from our business; our ESG strategy and initiatives, including those relating to the generation and marketing of environmental attributes or new products seeking to benefit from ESG related activities; general economic conditions, including cost inflation; credit markets and the ability to obtain future financing on commercially acceptable terms; our ability to expand our business, including through the recruitment and retention of skilled personnel; our dependence on our key management personnel; our future operating results; and our plans, objectives, expectations and intentions. Except as otherwise required by applicable law, we disclaim any duty to update any forward-looking statements, all of which are expressly qualified by the statements in this section, to reflect events or circumstances after the date of this presentation. Tamboran is subject to known and unknown risks, many of which are beyond the ability of Tamboran to control or predict. These risks may include, for example, movements in oil and gas prices, risks associated with the development and operation of the acreage, exchange rate fluctuations, an inability to obtain funding on acceptable terms or at all, loss of key personnel, an inability to obtain appropriate licenses, permits and/or other approvals, inaccuracies in resource estimates, share market risks and changes in general economic conditions. Such risks may affect actual and future results of Tamboran and its securities. Maps and diagrams contained in this presentation are provided to assist with the identification and description of Tamboran’s interests. The maps and diagrams may not be drawn to scale. This presentation includes market data and other statistical information from third party sources, including independent industry publications, government publications or other published independent sources. Although we believe these third-party sources are reliable as of their respective dates, we have not independently verified the accuracy or completeness of this information. The industry in which we operate is subject to a high degree of uncertainty and risk due to a variety of factors, which could cause our results to differ materially from those expressed in these third-party publications. Numbers in this report have been rounded. As a result, some figures may differ insignificantly due to rounding and totals reported may differ insignificantly from arithmetic addition of the rounded numbers. All currency amounts are represented as USD unless otherwise stated (AUD/USD exchange rate of 0.7055). This presentation does not purport to be all inclusive or to necessarily contain all the information that you may need or desire to perform your analysis. In all cases, you should conduct your own investigation and analysis of the data set forth in this presentation, and should rely solely on your own judgment, review and analysis in evaluating this presentation. This presentation contains trademarks, tradenames and servicemarks of other companies that are the property of their respective owners. We do not intend our use or display of other companies’ trademarks, tradenames and servicemarks to imply relationships with, or endorsement or sponsorship of us by, these other companies. This presentation was approved and authorized for release by Todd Abbott, the Managing Director and Chief Executive Officer of Tamboran Resources Corporation. Disclaimer 2
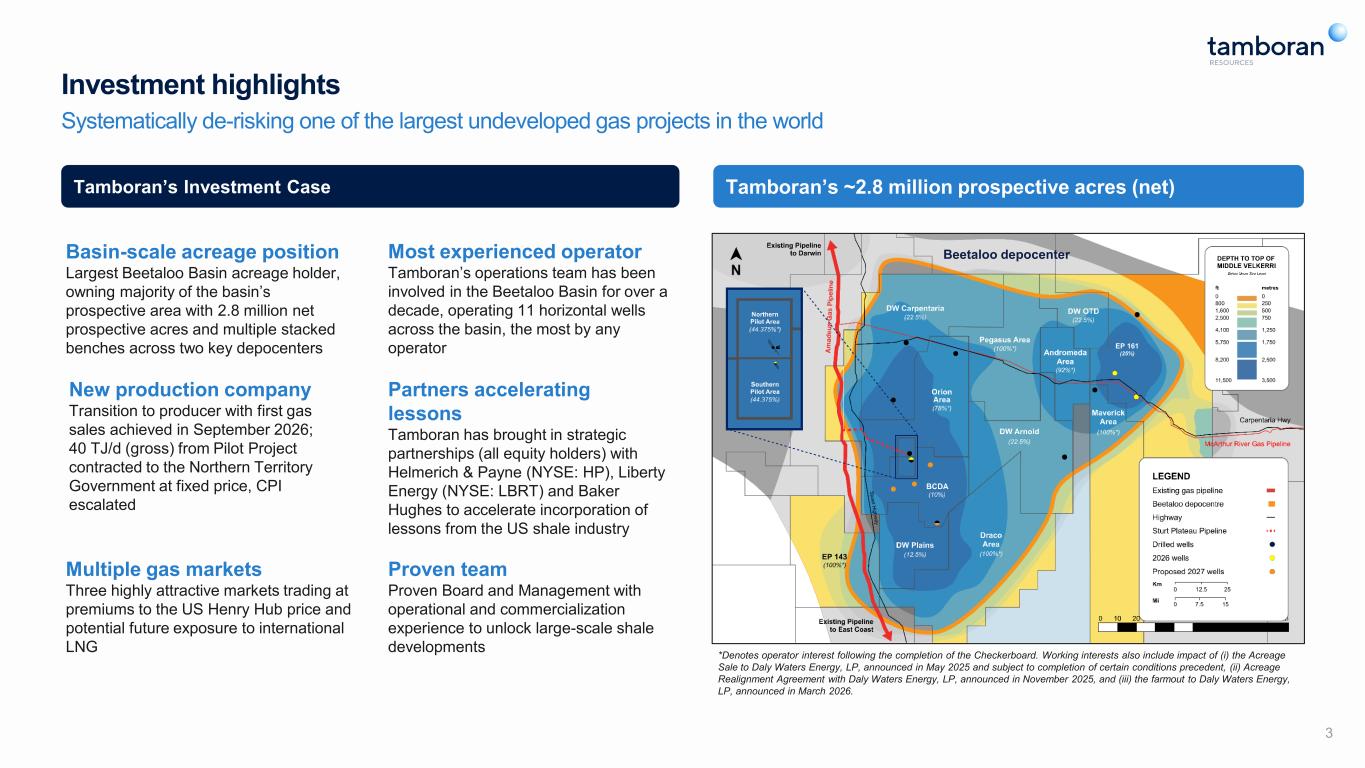
3 Investment highlights Systematically de-risking one of the largest undeveloped gas projects in the world Tamboran’s Investment Case New production company Transition to producer with first gas sales achieved in September 2026; 40 TJ/d (gross) from Pilot Project contracted to the Northern Territory Government at fixed price, CPI escalated Proven team Proven Board and Management with operational and commercialization experience to unlock large-scale shale developments Partners accelerating lessons Tamboran has brought in strategic partnerships (all equity holders) with Helmerich & Payne (NYSE: HP), Liberty Energy (NYSE: LBRT) and Baker Hughes to accelerate incorporation of lessons from the US shale industry Most experienced operator Tamboran’s operations team has been involved in the Beetaloo Basin for over a decade, operating 11 horizontal wells across the basin, the most by any operator Basin-scale acreage position Largest Beetaloo Basin acreage holder, owning majority of the basin’s prospective area with 2.8 million net prospective acres and multiple stacked benches across two key depocenters Multiple gas markets Three highly attractive markets trading at premiums to the US Henry Hub price and potential future exposure to international LNG Tamboran’s ~2.8 million prospective acres (net) Beetaloo depocenter *Denotes operator interest following the completion of the Checkerboard. Working interests also include impact of (i) the Acreage Sale to Daly Waters Energy, LP, announced in May 2025 and subject to completion of certain conditions precedent, (ii) Acreage Realignment Agreement with Daly Waters Energy, LP, announced in November 2025, and (iii) the farmout to Daly Waters Energy, LP, announced in March 2026. EP 161 (25%)
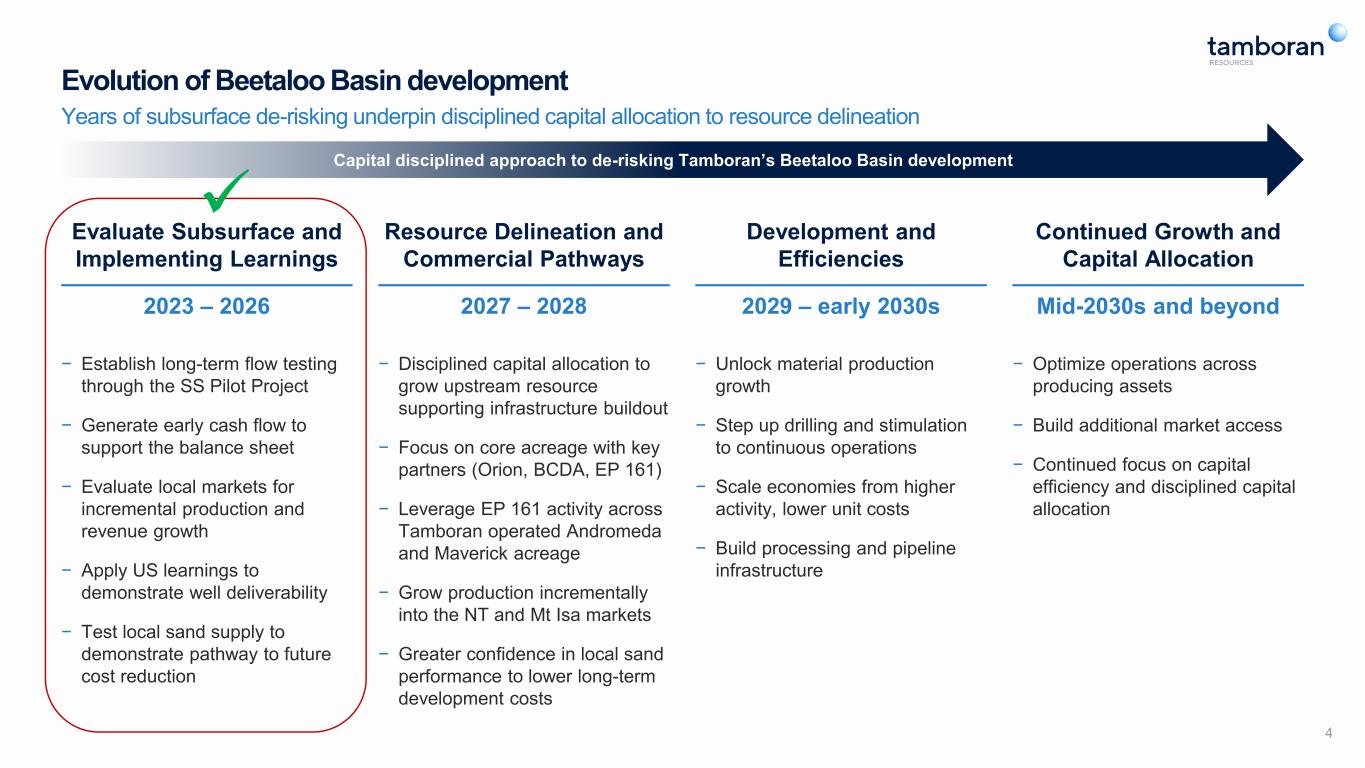
Evolution of Beetaloo Basin development Years of subsurface de-risking underpin disciplined capital allocation to resource delineation 4 Evaluate Subsurface and Implementing Learnings − Establish long-term flow testing through the SS Pilot Project − Generate early cash flow to support the balance sheet − Evaluate local markets for incremental production and revenue growth − Apply US learnings to demonstrate well deliverability − Test local sand supply to demonstrate pathway to future cost reduction Resource Delineation and Commercial Pathways − Disciplined capital allocation to grow upstream resource supporting infrastructure buildout − Focus on core acreage with key partners (Orion, BCDA, EP 161) − Leverage EP 161 activity across Tamboran operated Andromeda and Maverick acreage − Grow production incrementally into the NT and Mt Isa markets − Greater confidence in local sand performance to lower long-term development costs Development and Efficiencies − Unlock material production growth − Step up drilling and stimulation to continuous operations − Scale economies from higher activity, lower unit costs − Build processing and pipeline infrastructure Continued Growth and Capital Allocation − Optimize operations across producing assets − Build additional market access − Continued focus on capital efficiency and disciplined capital allocation 2023 – 2026 2027 – 2028 2029 – early 2030s Mid-2030s and beyond Capital disciplined approach to de-risking Tamboran’s Beetaloo Basin development ✓
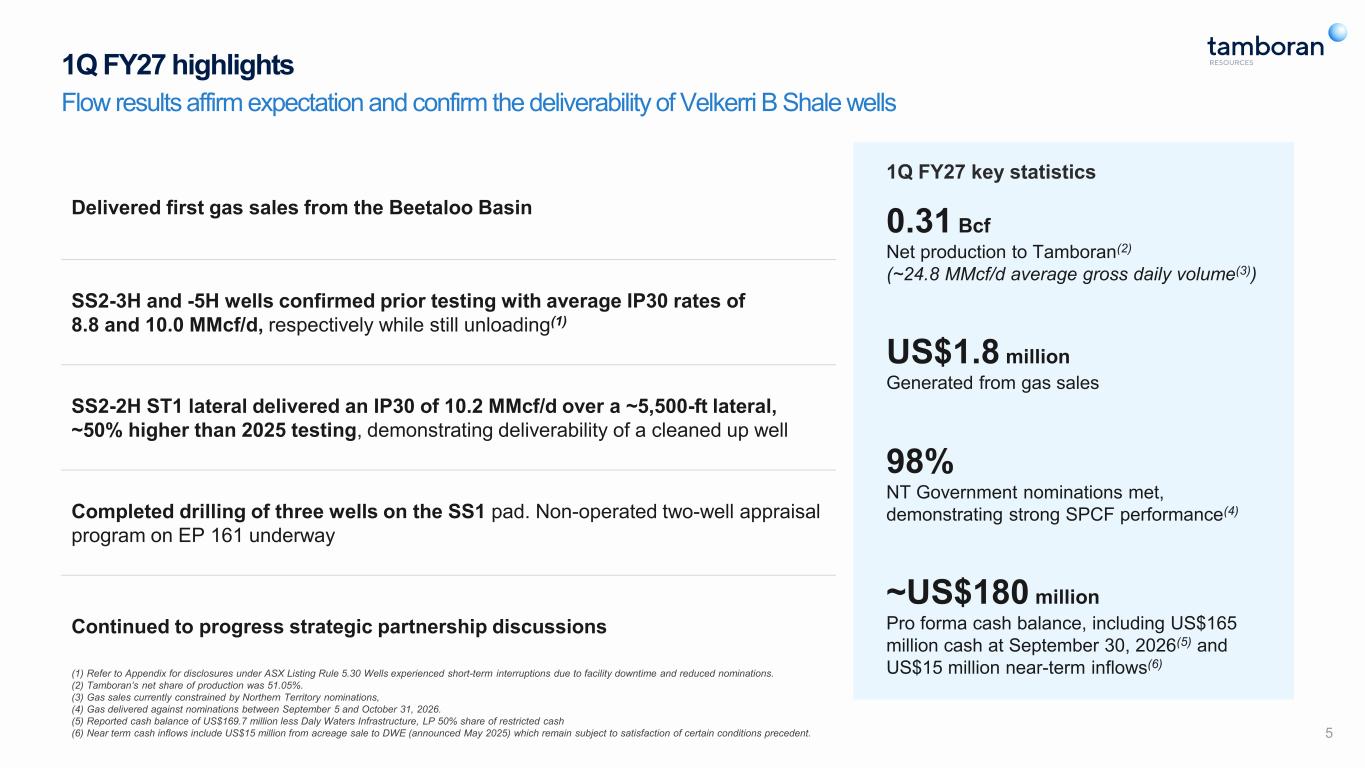
1Q FY27 highlights Flow results affirm expectation and confirm the deliverability of Velkerri B Shale wells Delivered first gas sales from the Beetaloo Basin SS2-3H and -5H wells confirmed prior testing with average IP30 rates of 8.8 and 10.0 MMcf/d, respectively while still unloading(1) SS2-2H ST1 lateral delivered an IP30 of 10.2 MMcf/d over a ~5,500-ft lateral, ~50% higher than 2025 testing, demonstrating deliverability of a cleaned up well Completed drilling of three wells on the SS1 pad. Non-operated two-well appraisal program on EP 161 underway Continued to progress strategic partnership discussions 1Q FY27 key statistics 0.31 Bcf Net production to Tamboran(2) (~24.8 MMcf/d average gross daily volume(3)) US$1.8 million Generated from gas sales 98% NT Government nominations met, demonstrating strong SPCF performance(4) ~US$180 million Pro forma cash balance, including US$165 million cash at September 30, 2026(5) and US$15 million near-term inflows(6) (1) Refer to Appendix for disclosures under ASX Listing Rule 5.30 Wells experienced short-term interruptions due to facility downtime and reduced nominations. (2) Tamboran’s net share of production was 51.05%. (3) Gas sales currently constrained by Northern Territory nominations, (4) Gas delivered against nominations between September 5 and October 31, 2026. (5) Reported cash balance of US$169.7 million less Daly Waters Infrastructure, LP 50% share of restricted cash (6) Near term cash inflows include US$15 million from acreage sale to DWE (announced May 2025) which remain subject to satisfaction of certain conditions precedent. 5
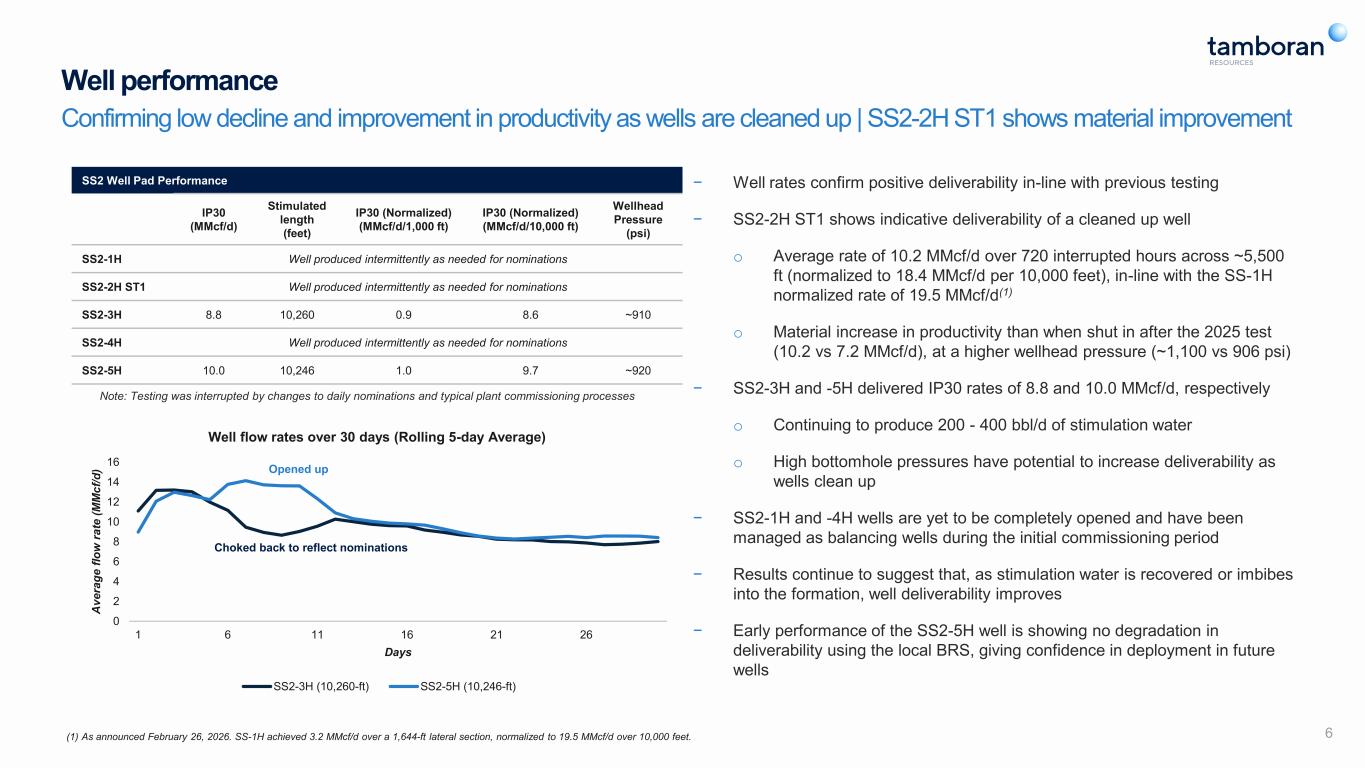
− Well rates confirm positive deliverability in-line with previous testing − SS2-2H ST1 shows indicative deliverability of a cleaned up well o Average rate of 10.2 MMcf/d over 720 interrupted hours across ~5,500 ft (normalized to 18.4 MMcf/d per 10,000 feet), in-line with the SS-1H normalized rate of 19.5 MMcf/d(1) o Material increase in productivity than when shut in after the 2025 test (10.2 vs 7.2 MMcf/d), at a higher wellhead pressure (~1,100 vs 906 psi) − SS2-3H and -5H delivered IP30 rates of 8.8 and 10.0 MMcf/d, respectively o Continuing to produce 200 - 400 bbl/d of stimulation water o High bottomhole pressures have potential to increase deliverability as wells clean up − SS2-1H and -4H wells are yet to be completely opened and have been managed as balancing wells during the initial commissioning period − Results continue to suggest that, as stimulation water is recovered or imbibes into the formation, well deliverability improves − Early performance of the SS2-5H well is showing no degradation in deliverability using the local BRS, giving confidence in deployment in future wells Well performance Confirming low decline and improvement in productivity as wells are cleaned up | SS2-2H ST1 shows material improvement 6 SS2 Well Pad Performance IP30 (MMcf/d) Stimulated length (feet) IP30 (Normalized) (MMcf/d/1,000 ft) IP30 (Normalized) (MMcf/d/10,000 ft) Wellhead Pressure (psi) SS2-1H Well produced intermittently as needed for nominations SS2-2H ST1 Well produced intermittently as needed for nominations SS2-3H 8.8 10,260 0.9 8.6 ~910 SS2-4H Well produced intermittently as needed for nominations SS2-5H 10.0 10,246 1.0 9.7 ~920 (1) As announced February 26, 2026. SS-1H achieved 3.2 MMcf/d over a 1,644-ft lateral section, normalized to 19.5 MMcf/d over 10,000 feet. 0 2 4 6 8 10 12 14 16 1 6 11 16 21 26 A v e ra g e f lo w r a te ( M M c f/ d ) Days Well flow rates over 30 days (Rolling 5-day Average) SS2-3H (10,260-ft) SS2-5H (10,246-ft) Note: Testing was interrupted by changes to daily nominations and typical plant commissioning processes Choked back to reflect nominations Opened up
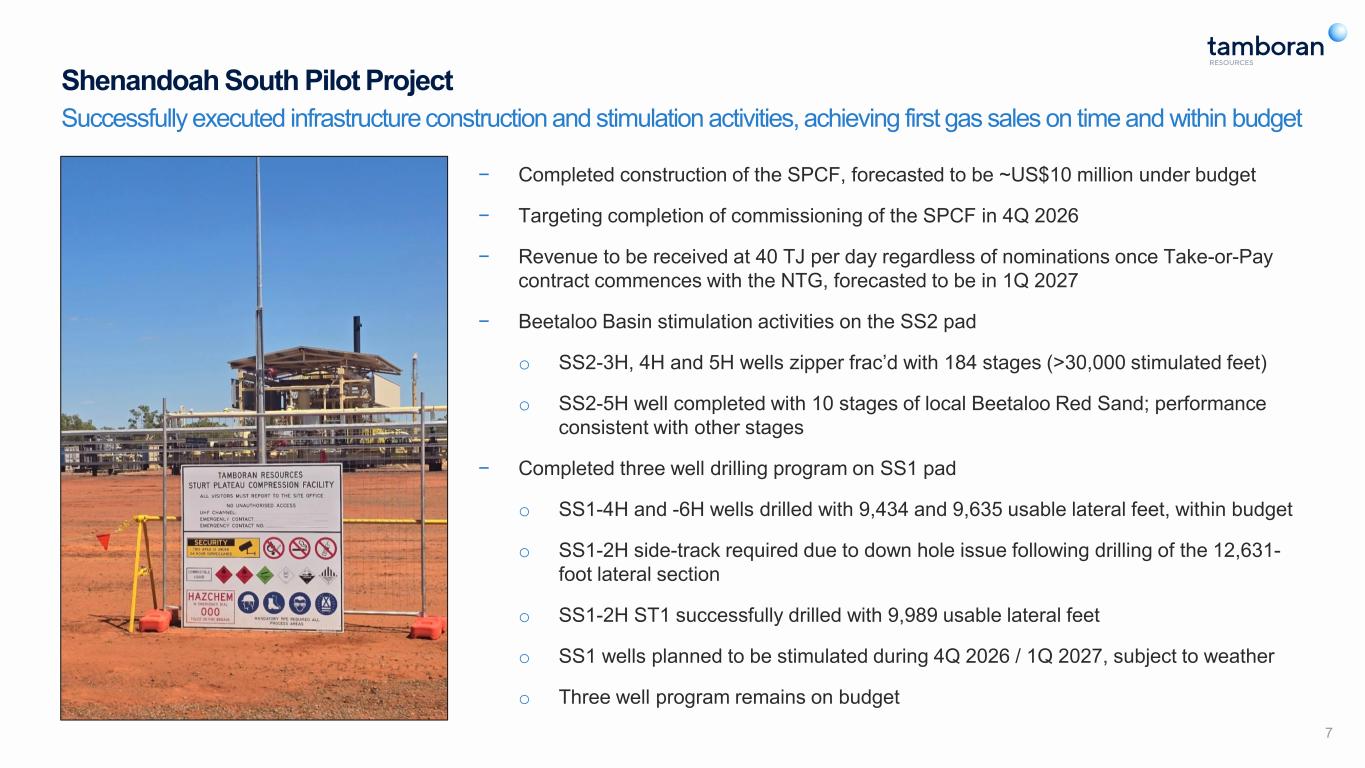
Shenandoah South Pilot Project Successfully executed infrastructure construction and stimulation activities, achieving first gas sales on time and within budget 7 − Completed construction of the SPCF, forecasted to be ~US$10 million under budget − Targeting completion of commissioning of the SPCF in 4Q 2026 − Revenue to be received at 40 TJ per day regardless of nominations once Take-or-Pay contract commences with the NTG, forecasted to be in 1Q 2027 − Beetaloo Basin stimulation activities on the SS2 pad o SS2-3H, 4H and 5H wells zipper frac’d with 184 stages (>30,000 stimulated feet) o SS2-5H well completed with 10 stages of local Beetaloo Red Sand; performance consistent with other stages − Completed three well drilling program on SS1 pad o SS1-4H and -6H wells drilled with 9,434 and 9,635 usable lateral feet, within budget o SS1-2H side-track required due to down hole issue following drilling of the 12,631- foot lateral section o SS1-2H ST1 successfully drilled with 9,989 usable lateral feet o SS1 wells planned to be stimulated during 4Q 2026 / 1Q 2027, subject to weather o Three well program remains on budget
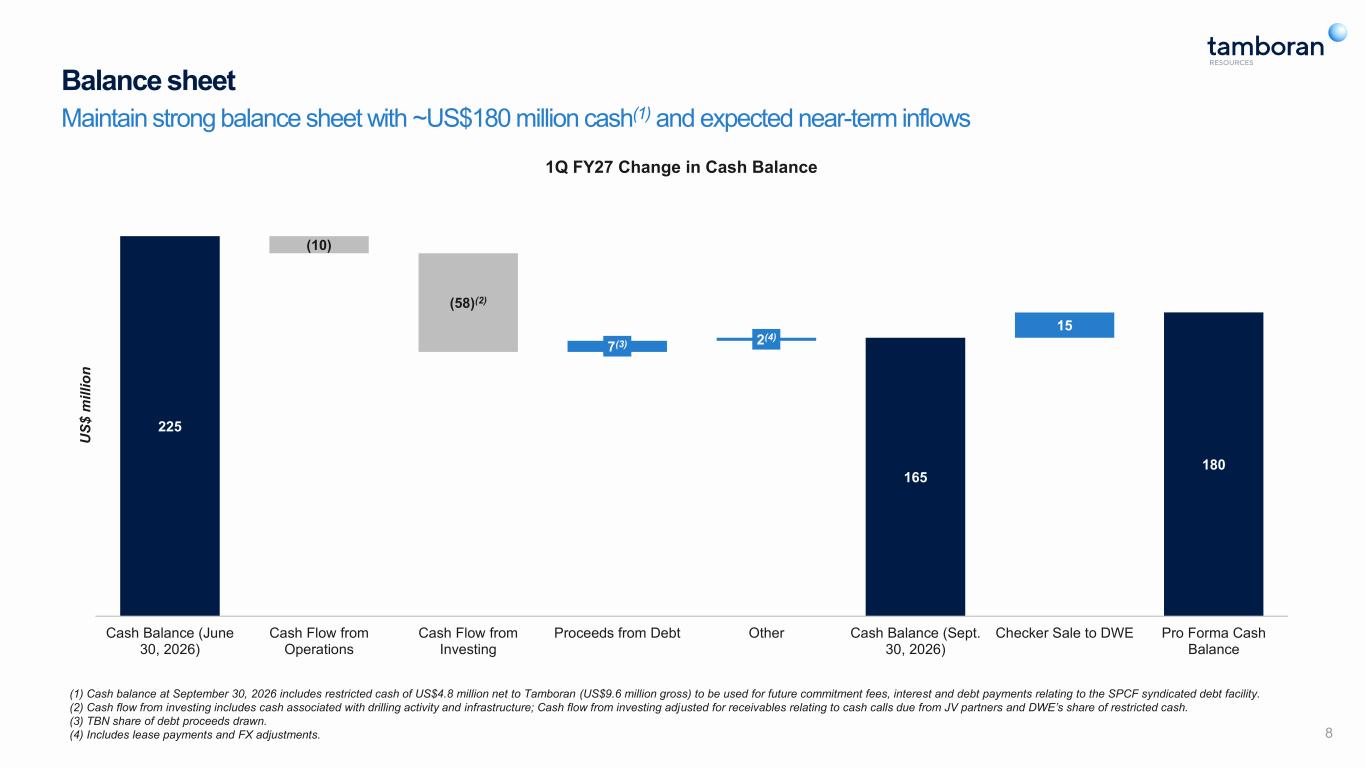
Balance sheet 8 (1) Cash balance at September 30, 2026 includes restricted cash of US$4.8 million net to Tamboran (US$9.6 million gross) to be used for future commitment fees, interest and debt payments relating to the SPCF syndicated debt facility. (2) Cash flow from investing includes cash associated with drilling activity and infrastructure; Cash flow from investing adjusted for receivables relating to cash calls due from JV partners and DWE’s share of restricted cash. (3) TBN share of debt proceeds drawn. (4) Includes lease payments and FX adjustments. Maintain strong balance sheet with ~US$180 million cash(1) and expected near-term inflows 165 180 (10) (58)(2) 225 7(3) 2(4) 15 Cash Balance (June 30, 2026) Cash Flow from Operations Cash Flow from Investing Proceeds from Debt Other Cash Balance (Sept. 30, 2026) Checker Sale to DWE Pro Forma Cash Balance U S $ m il li o n 1Q FY27 Change in Cash Balance
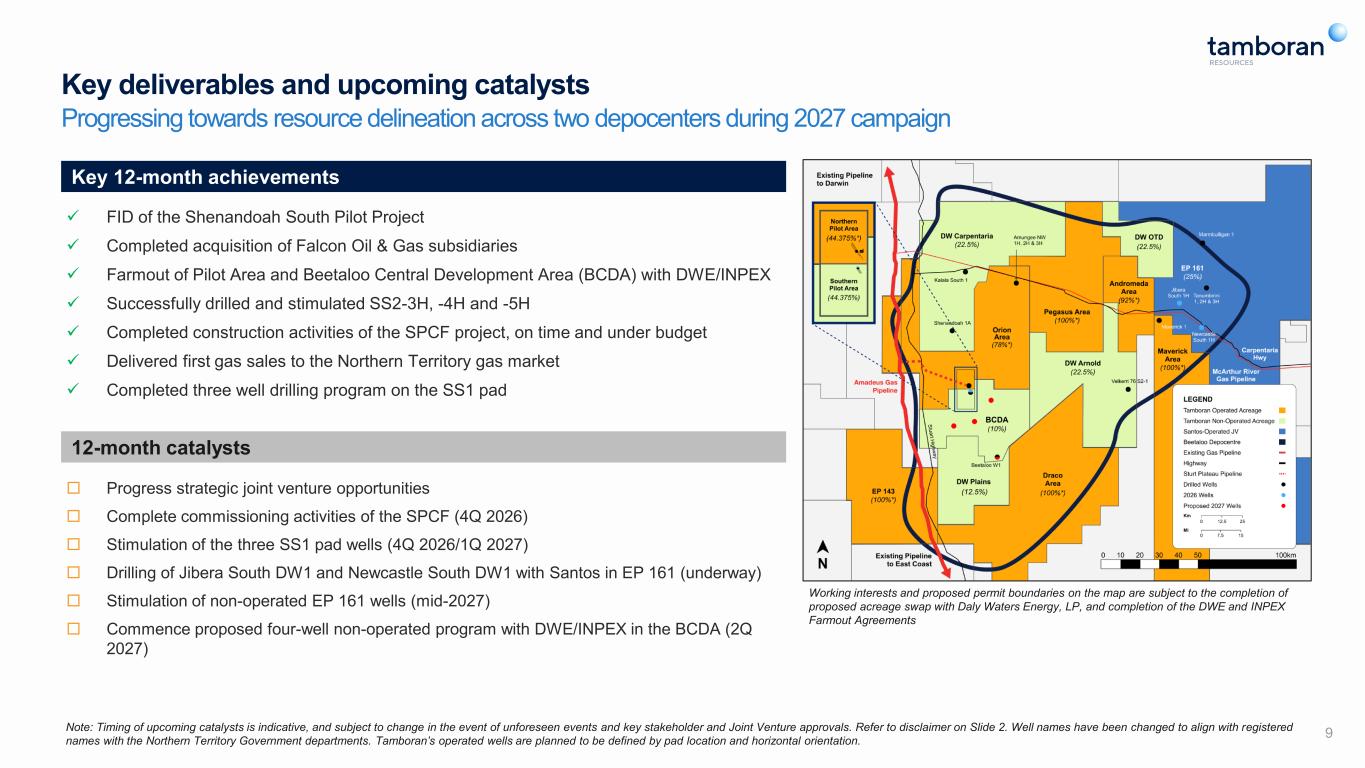
Key deliverables and upcoming catalysts Note: Timing of upcoming catalysts is indicative, and subject to change in the event of unforeseen events and key stakeholder and Joint Venture approvals. Refer to disclaimer on Slide 2. Well names have been changed to align with registered names with the Northern Territory Government departments. Tamboran’s operated wells are planned to be defined by pad location and horizontal orientation. 9 Key 12-month achievements ✓ FID of the Shenandoah South Pilot Project ✓ Completed acquisition of Falcon Oil & Gas subsidiaries ✓ Farmout of Pilot Area and Beetaloo Central Development Area (BCDA) with DWE/INPEX ✓ Successfully drilled and stimulated SS2-3H, -4H and -5H ✓ Completed construction activities of the SPCF project, on time and under budget ✓ Delivered first gas sales to the Northern Territory gas market ✓ Completed three well drilling program on the SS1 pad Progress strategic joint venture opportunities Complete commissioning activities of the SPCF (4Q 2026) Stimulation of the three SS1 pad wells (4Q 2026/1Q 2027) Drilling of Jibera South DW1 and Newcastle South DW1 with Santos in EP 161 (underway) Stimulation of non-operated EP 161 wells (mid-2027) Commence proposed four-well non-operated program with DWE/INPEX in the BCDA (2Q 2027) Progressing towards resource delineation across two depocenters during 2027 campaign 12-month catalysts Working interests and proposed permit boundaries on the map are subject to the completion of proposed acreage swap with Daly Waters Energy, LP, and completion of the DWE and INPEX Farmout Agreements

Appendix
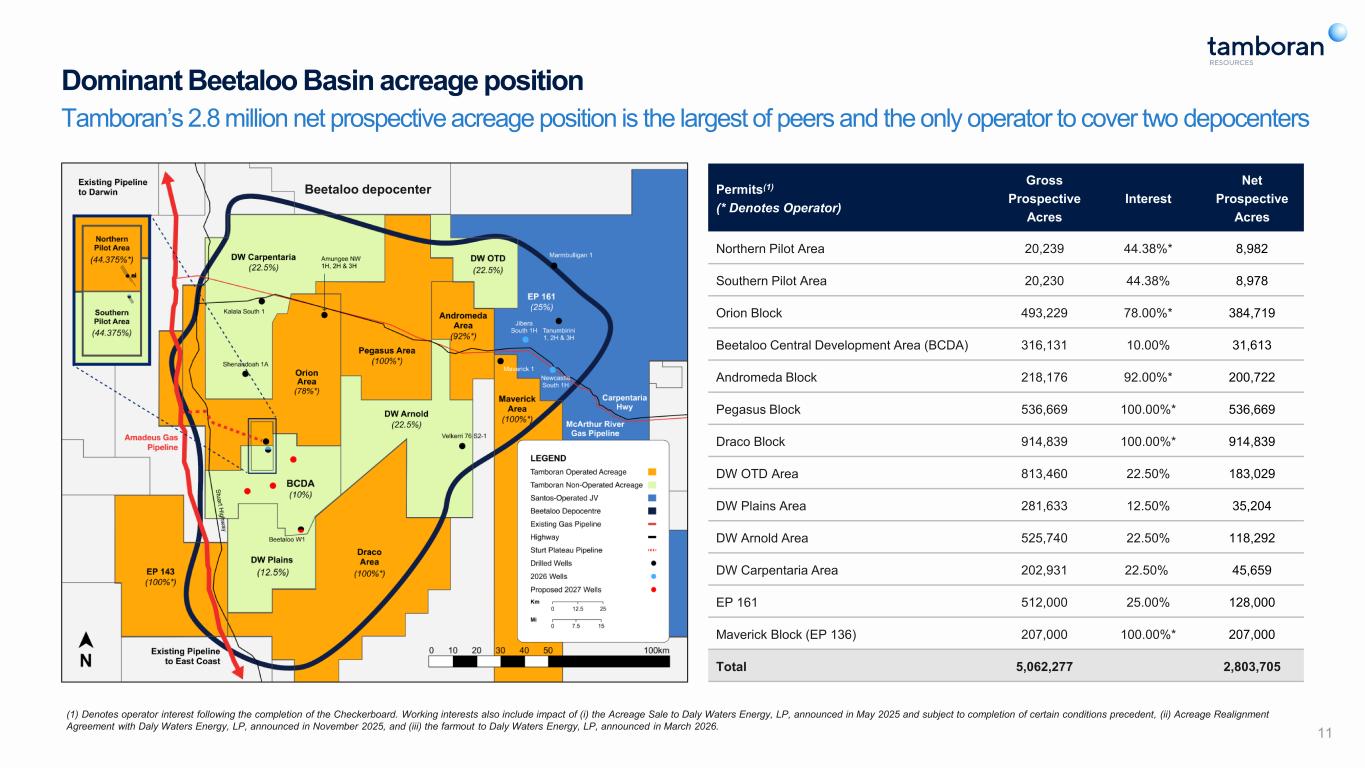
11 Dominant Beetaloo Basin acreage position Tamboran’s 2.8 million net prospective acreage position is the largest of peers and the only operator to cover two depocenters Permits(1) (* Denotes Operator) Gross Prospective Acres Interest Net Prospective Acres Northern Pilot Area 20,239 44.38%* 8,982 Southern Pilot Area 20,230 44.38% 8,978 Orion Block 493,229 78.00%* 384,719 Beetaloo Central Development Area (BCDA) 316,131 10.00% 31,613 Andromeda Block 218,176 92.00%* 200,722 Pegasus Block 536,669 100.00%* 536,669 Draco Block 914,839 100.00%* 914,839 DW OTD Area 813,460 22.50% 183,029 DW Plains Area 281,633 12.50% 35,204 DW Arnold Area 525,740 22.50% 118,292 DW Carpentaria Area 202,931 22.50% 45,659 EP 161 512,000 25.00% 128,000 Maverick Block (EP 136) 207,000 100.00%* 207,000 Total 5,062,277 2,803,705 Beetaloo depocenter (1) Denotes operator interest following the completion of the Checkerboard. Working interests also include impact of (i) the Acreage Sale to Daly Waters Energy, LP, announced in May 2025 and subject to completion of certain conditions precedent, (ii) Acreage Realignment Agreement with Daly Waters Energy, LP, announced in November 2025, and (iii) the farmout to Daly Waters Energy, LP, announced in March 2026.
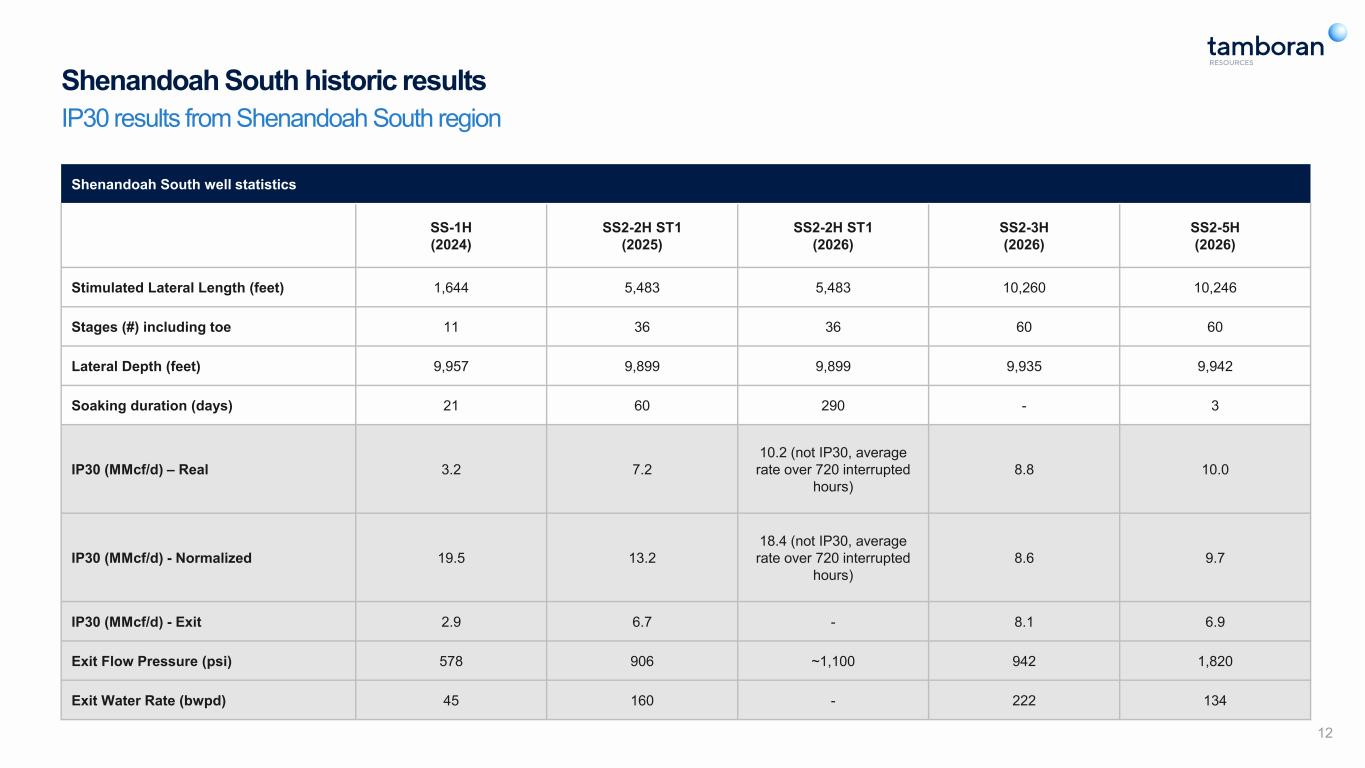
Shenandoah South historic results IP30 results from Shenandoah South region 12 Shenandoah South well statistics SS-1H (2024) SS2-2H ST1 (2025) SS2-2H ST1 (2026) SS2-3H (2026) SS2-5H (2026) Stimulated Lateral Length (feet) 1,644 5,483 5,483 10,260 10,246 Stages (#) including toe 11 36 36 60 60 Lateral Depth (feet) 9,957 9,899 9,899 9,935 9,942 Soaking duration (days) 21 60 290 - 3 IP30 (MMcf/d) – Real 3.2 7.2 10.2 (not IP30, average rate over 720 interrupted hours) 8.8 10.0 IP30 (MMcf/d) - Normalized 19.5 13.2 18.4 (not IP30, average rate over 720 interrupted hours) 8.6 9.7 IP30 (MMcf/d) - Exit 2.9 6.7 - 8.1 6.9 Exit Flow Pressure (psi) 578 906 ~1,100 942 1,820 Exit Water Rate (bwpd) 45 160 - 222 134
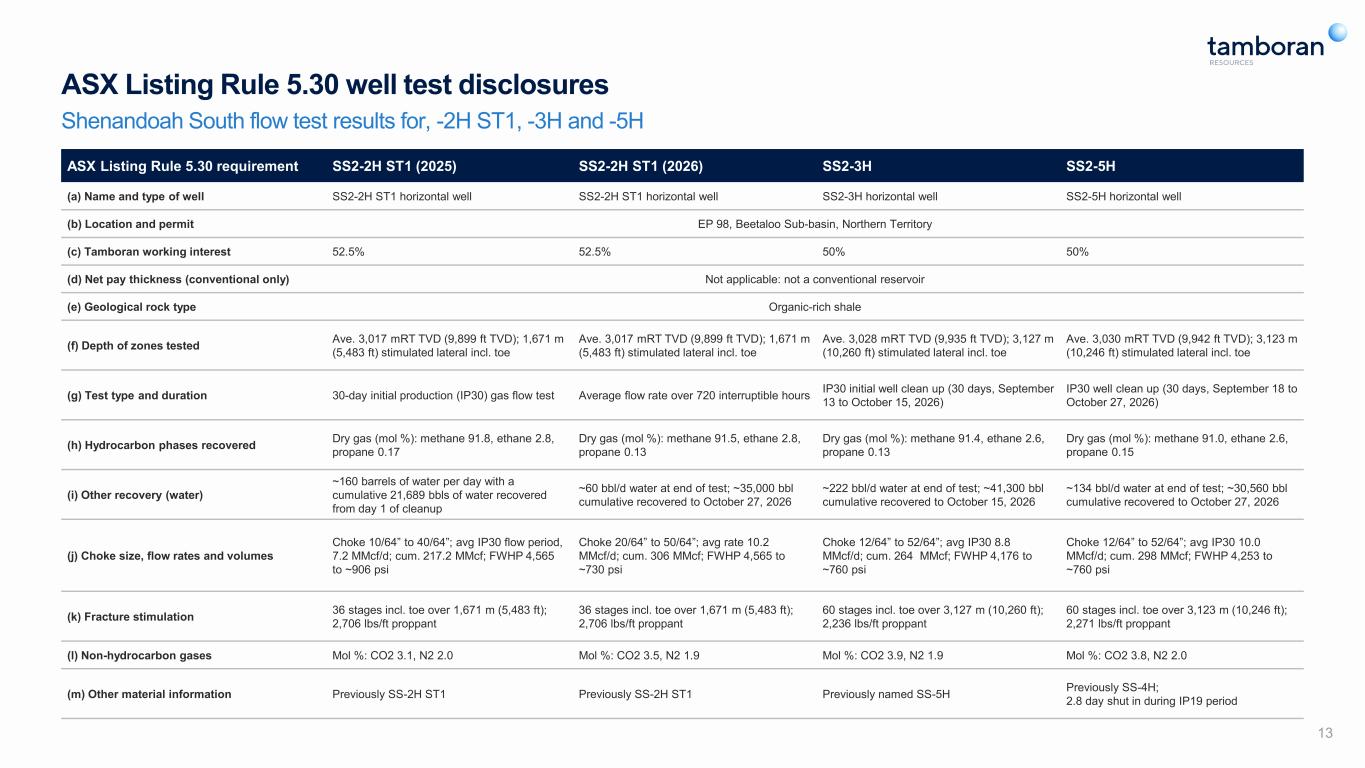
13 ASX Listing Rule 5.30 requirement SS2-2H ST1 (2025) SS2-2H ST1 (2026) SS2-3H SS2-5H (a) Name and type of well SS2-2H ST1 horizontal well SS2-2H ST1 horizontal well SS2-3H horizontal well SS2-5H horizontal well (b) Location and permit EP 98, Beetaloo Sub-basin, Northern Territory (c) Tamboran working interest 52.5% 52.5% 50% 50% (d) Net pay thickness (conventional only) Not applicable: not a conventional reservoir (e) Geological rock type Organic-rich shale (f) Depth of zones tested Ave. 3,017 mRT TVD (9,899 ft TVD); 1,671 m (5,483 ft) stimulated lateral incl. toe Ave. 3,017 mRT TVD (9,899 ft TVD); 1,671 m (5,483 ft) stimulated lateral incl. toe Ave. 3,028 mRT TVD (9,935 ft TVD); 3,127 m (10,260 ft) stimulated lateral incl. toe Ave. 3,030 mRT TVD (9,942 ft TVD); 3,123 m (10,246 ft) stimulated lateral incl. toe (g) Test type and duration 30-day initial production (IP30) gas flow test Average flow rate over 720 interruptible hours IP30 initial well clean up (30 days, September 13 to October 15, 2026) IP30 well clean up (30 days, September 18 to October 27, 2026) (h) Hydrocarbon phases recovered Dry gas (mol %): methane 91.8, ethane 2.8, propane 0.17 Dry gas (mol %): methane 91.5, ethane 2.8, propane 0.13 Dry gas (mol %): methane 91.4, ethane 2.6, propane 0.13 Dry gas (mol %): methane 91.0, ethane 2.6, propane 0.15 (i) Other recovery (water) ~160 barrels of water per day with a cumulative 21,689 bbls of water recovered from day 1 of cleanup ~60 bbl/d water at end of test; ~35,000 bbl cumulative recovered to October 27, 2026 ~222 bbl/d water at end of test; ~41,300 bbl cumulative recovered to October 15, 2026 ~134 bbl/d water at end of test; ~30,560 bbl cumulative recovered to October 27, 2026 (j) Choke size, flow rates and volumes Choke 10/64” to 40/64”; avg IP30 flow period, 7.2 MMcf/d; cum. 217.2 MMcf; FWHP 4,565 to ~906 psi Choke 20/64” to 50/64”; avg rate 10.2 MMcf/d; cum. 306 MMcf; FWHP 4,565 to ~730 psi Choke 12/64” to 52/64”; avg IP30 8.8 MMcf/d; cum. 264 MMcf; FWHP 4,176 to ~760 psi Choke 12/64” to 52/64”; avg IP30 10.0 MMcf/d; cum. 298 MMcf; FWHP 4,253 to ~760 psi (k) Fracture stimulation 36 stages incl. toe over 1,671 m (5,483 ft); 2,706 lbs/ft proppant 36 stages incl. toe over 1,671 m (5,483 ft); 2,706 lbs/ft proppant 60 stages incl. toe over 3,127 m (10,260 ft); 2,236 lbs/ft proppant 60 stages incl. toe over 3,123 m (10,246 ft); 2,271 lbs/ft proppant (l) Non-hydrocarbon gases Mol %: CO2 3.1, N2 2.0 Mol %: CO2 3.5, N2 1.9 Mol %: CO2 3.9, N2 1.9 Mol %: CO2 3.8, N2 2.0 (m) Other material information Previously SS-2H ST1 Previously SS-2H ST1 Previously named SS-5H Previously SS-4H; 2.8 day shut in during IP19 period ASX Listing Rule 5.30 well test disclosures Shenandoah South flow test results for, -2H ST1, -3H and -5H
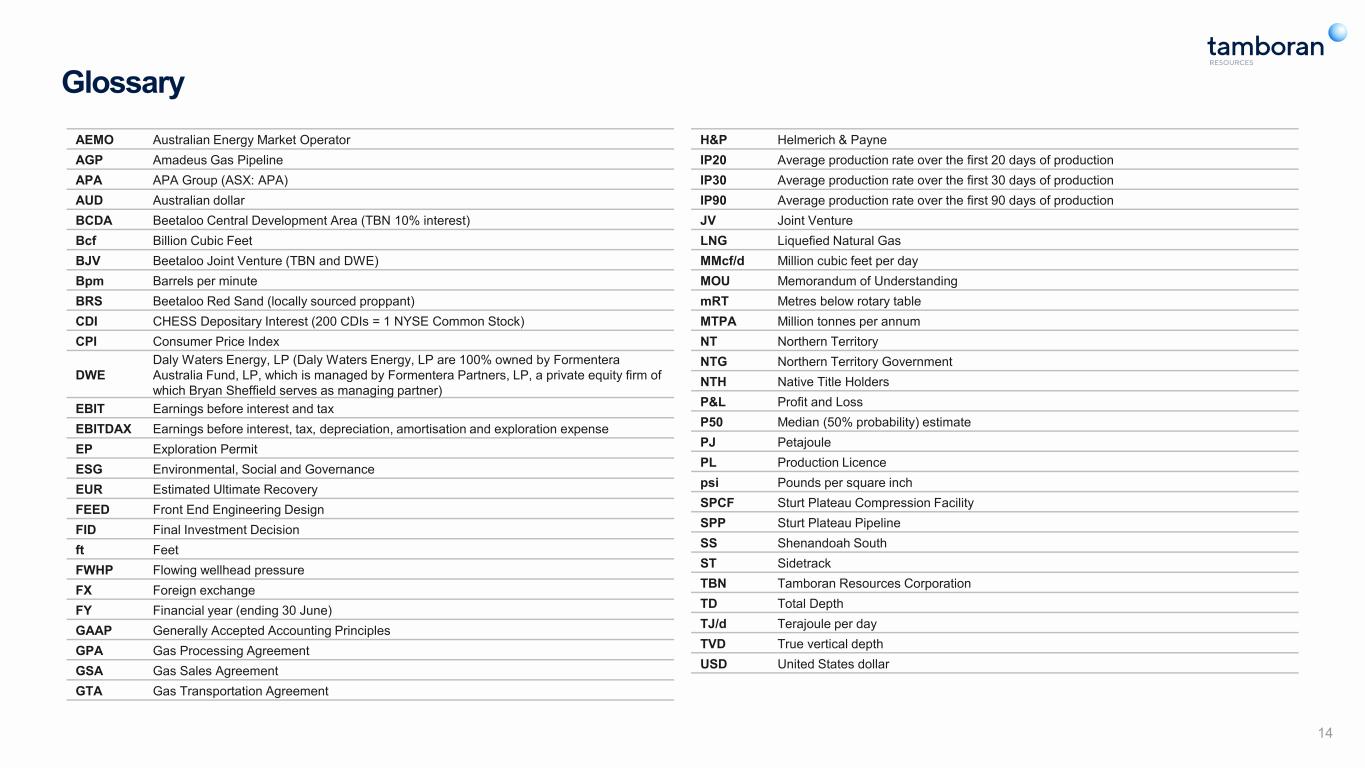
Glossary AEMO Australian Energy Market Operator AGP Amadeus Gas Pipeline APA APA Group (ASX: APA) AUD Australian dollar BCDA Beetaloo Central Development Area (TBN 10% interest) Bcf Billion Cubic Feet BJV Beetaloo Joint Venture (TBN and DWE) Bpm Barrels per minute BRS Beetaloo Red Sand (locally sourced proppant) CDI CHESS Depositary Interest (200 CDIs = 1 NYSE Common Stock) CPI Consumer Price Index DWE Daly Waters Energy, LP (Daly Waters Energy, LP are 100% owned by Formentera Australia Fund, LP, which is managed by Formentera Partners, LP, a private equity firm of which Bryan Sheffield serves as managing partner) EBIT Earnings before interest and tax EBITDAX Earnings before interest, tax, depreciation, amortisation and exploration expense EP Exploration Permit ESG Environmental, Social and Governance EUR Estimated Ultimate Recovery FEED Front End Engineering Design FID Final Investment Decision ft Feet FWHP Flowing wellhead pressure FX Foreign exchange FY Financial year (ending 30 June) GAAP Generally Accepted Accounting Principles GPA Gas Processing Agreement GSA Gas Sales Agreement GTA Gas Transportation Agreement 14 H&P Helmerich & Payne IP20 Average production rate over the first 20 days of production IP30 Average production rate over the first 30 days of production IP90 Average production rate over the first 90 days of production JV Joint Venture LNG Liquefied Natural Gas MMcf/d Million cubic feet per day MOU Memorandum of Understanding mRT Metres below rotary table MTPA Million tonnes per annum NT Northern Territory NTG Northern Territory Government NTH Native Title Holders P&L Profit and Loss P50 Median (50% probability) estimate PJ Petajoule PL Production Licence psi Pounds per square inch SPCF Sturt Plateau Compression Facility SPP Sturt Plateau Pipeline SS Shenandoah South ST Sidetrack TBN Tamboran Resources Corporation TD Total Depth TJ/d Terajoule per day TVD True vertical depth USD United States dollar