EX-99.1
Published on August 31, 2026
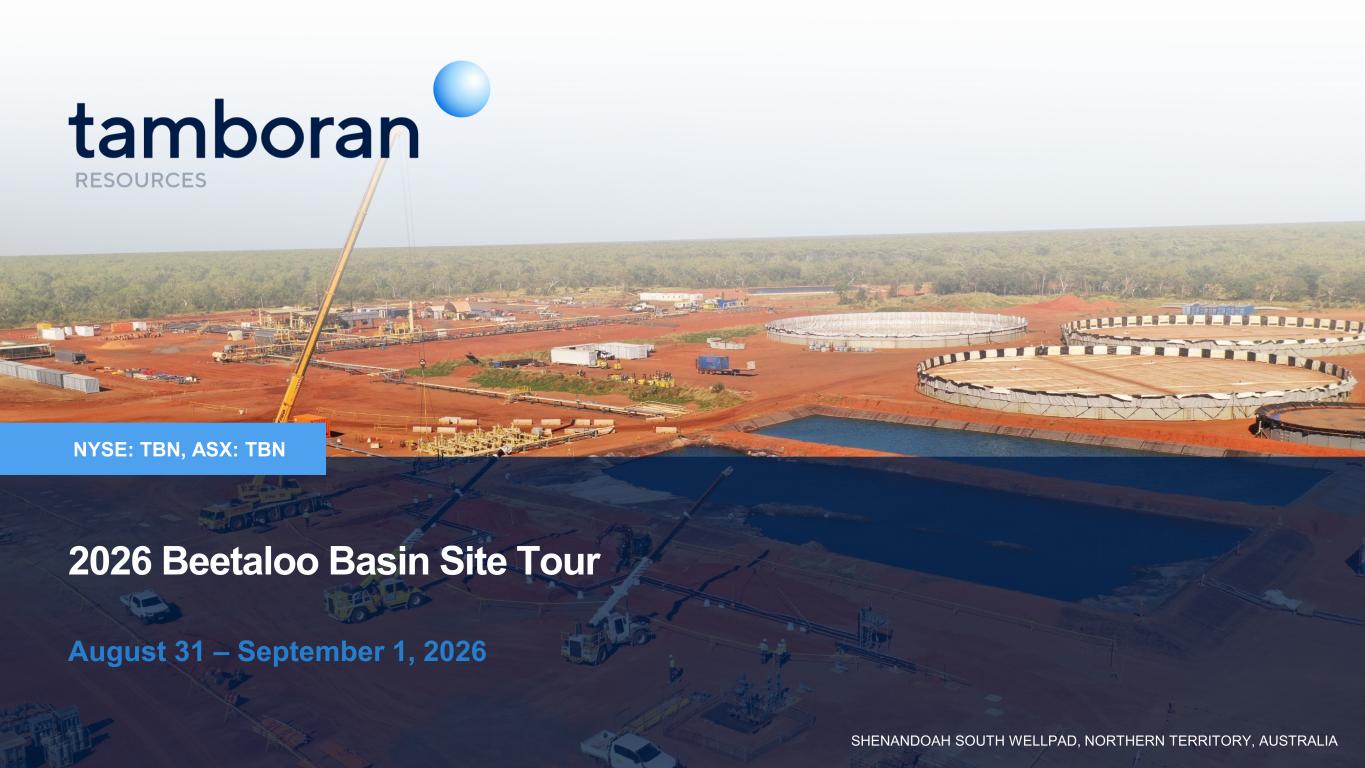
NYSE: TBN, ASX: TBN 2026 Beetaloo Basin Site Tour August 31 – September 1, 2026 SHENANDOAH SOUTH WELLPAD, NORTHERN TERRITORY, AUSTRALIA
Disclaimer Disclaimer The information in this presentation includes “forward-looking statements” within the meaning of Section 27A of the Securities Act of 1933, as amended (the “Securities Act”), and Section 21E of the Securities Exchange Act of 1934, as amended (the “Exchange Act”), which include statements on Tamboran Resources Corporation's ("we", "us" or the "Company") opinions, expectations, beliefs, plans, objectives, assumptions or projections regarding future events or future results. All statements, other than statements of historical fact included in this presentation regarding our strategy, present and future operations, financial position, estimated revenues and losses, projected costs, estimated reserves, prospects, plans and objectives of management are forward-looking statements. When used in this presentation, words such as “may,” “assume,” “forecast,” “could,” “should,” “will,” “plan,” “believe,” “anticipate,” “intend,” “estimate,” “expect,” “project,” “budget”, "achieve," "progress," "target," "expand," "deliver," "potential," "propose," "enter," "provide," "contribute," and similar expressions are used to identify forward-looking statements, although not all forward-looking statements contain such identifying words. These forward-looking statements are based on management’s current belief, based on currently available information, as to the outcome and timing of future events at the time such statement was made. These forward-looking statements are not a guarantee of our performance, and you should not place undue reliance on such statements. Forward-looking statements may include statements about, among other things: our business strategy and the successful implementation of our business strategy; our future reserves; our financial strategy, liquidity and capital required for our development programs; estimated natural gas prices; our dividend policy; the timing and amount of future production of natural gas; our drilling and production plans; competition and government regulation; our ability to obtain and retain permits and governmental approvals; legal, regulatory or environmental matters; marketing of natural gas; business or leasehold acquisitions and integration of acquired businesses; our ability to develop our properties; the availability and cost of developing appropriate infrastructure around and transportation to our properties; the availability and cost of drilling rigs, production equipment, supplies, personnel and oilfield services; costs of developing our properties and of conducting our operations; our ability to reach FID and execute and complete our planned pipeline or planned LNG export projects; our anticipated Scope 1, Scope 2 and Scope 3 emissions from our businesses and our plans to offset our Scope 1, Scope 2 and Scope 3 emissions from our business; our ESG strategy and initiatives, including those relating to the generation and marketing of environmental attributes or new products seeking to benefit from ESG related activities; general economic conditions, including cost inflation; credit markets and the ability to obtain future financing on commercially acceptable terms; our ability to expand our business, including through the recruitment and retention of skilled personnel; our dependence on our key management personnel; our future operating results; and our plans, objectives, expectations and intentions. Except as otherwise required by applicable law, we disclaim any duty to update any forward-looking statements, all of which are expressly qualified by the statements in this section, to reflect events or circumstances after the date of this presentation. Tamboran is subject to known and unknown risks, many of which are beyond the ability of Tamboran to control or predict. These risks may include, for example, movements in oil and gas prices, risks associated with the development and operation of the acreage, exchange rate fluctuations, an inability to obtain funding on acceptable terms or at all, loss of key personnel, an inability to obtain appropriate licenses, permits and/or other approvals, inaccuracies in resource estimates, share market risks and changes in general economic conditions. Such risks may affect actual and future results of Tamboran and its securities. Maps and diagrams contained in this presentation are provided to assist with the identification and description of Tamboran’s interests. The maps and diagrams may not be drawn to scale. This presentation includes market data and other statistical information from third-party sources, including independent industry publications, government publications or other published independent sources. Although we believe these third-party sources are reliable as of their respective dates, we have not independently verified the accuracy or completeness of this information. The industry in which we operate is subject to a high degree of uncertainty and risk due to a variety of factors, which could cause our results to differ materially from those expressed in these third-party publications. Numbers in this report have been rounded. As a result, some figures may differ insignificantly due to rounding and totals reported may differ insignificantly from arithmetic addition of the rounded numbers. All currency amounts are represented as USD unless otherwise stated (AUD/USD exchange rate of 0.65). This presentation does not purport to be all-inclusive or to necessarily contain all the information that you may need or desire to perform your analysis. In all cases, you should conduct your own investigation and analysis of the data set forth in this presentation, and should rely solely on your own judgment, review and analysis in evaluating this presentation. This presentation contains trademarks, tradenames and servicemarks of other companies that are the property of their respective owners. We do not intend our use or display of other companies’ trademarks, tradenames and servicemarks to imply relationships with, or endorsement or sponsorship of us by, these other companies. This presentation was approved and authorized for release by Todd Abbott, the Chief Executive Officer of Tamboran Resources Corporation. 2
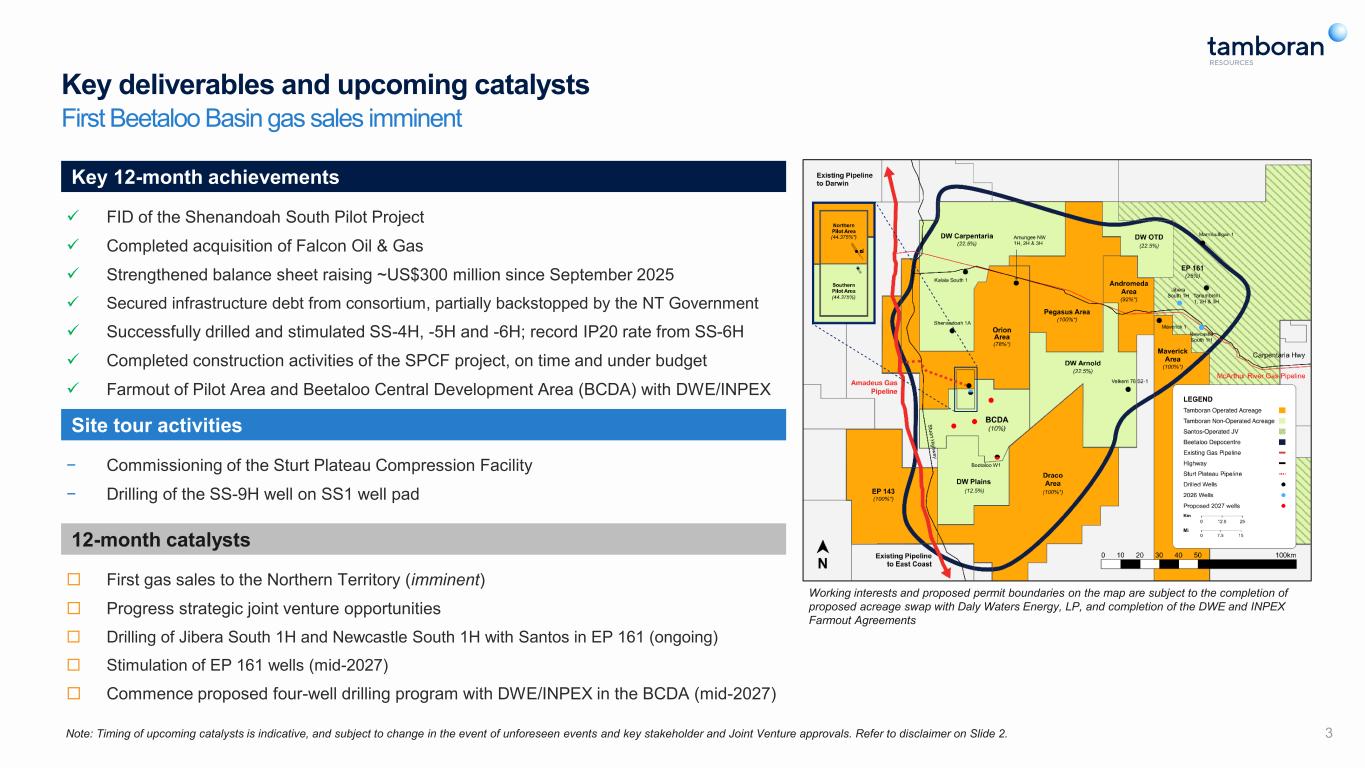
Key deliverables and upcoming catalysts Note: Timing of upcoming catalysts is indicative, and subject to change in the event of unforeseen events and key stakeholder and Joint Venture approvals. Refer to disclaimer on Slide 2. 3 Key 12-month achievements ✓ FID of the Shenandoah South Pilot Project ✓ Completed acquisition of Falcon Oil & Gas ✓ Strengthened balance sheet raising ~US$300 million since September 2025 ✓ Secured infrastructure debt from consortium, partially backstopped by the NT Government ✓ Successfully drilled and stimulated SS-4H, -5H and -6H; record IP20 rate from SS-6H ✓ Completed construction activities of the SPCF project, on time and under budget ✓ Farmout of Pilot Area and Beetaloo Central Development Area (BCDA) with DWE/INPEX Site tour activities − Commissioning of the Sturt Plateau Compression Facility − Drilling of the SS-9H well on SS1 well pad First gas sales to the Northern Territory (imminent) Progress strategic joint venture opportunities Drilling of Jibera South 1H and Newcastle South 1H with Santos in EP 161 (ongoing) Stimulation of EP 161 wells (mid-2027) Commence proposed four-well drilling program with DWE/INPEX in the BCDA (mid-2027) First Beetaloo Basin gas sales imminent 12-month catalysts Working interests and proposed permit boundaries on the map are subject to the completion of proposed acreage swap with Daly Waters Energy, LP, and completion of the DWE and INPEX Farmout Agreements
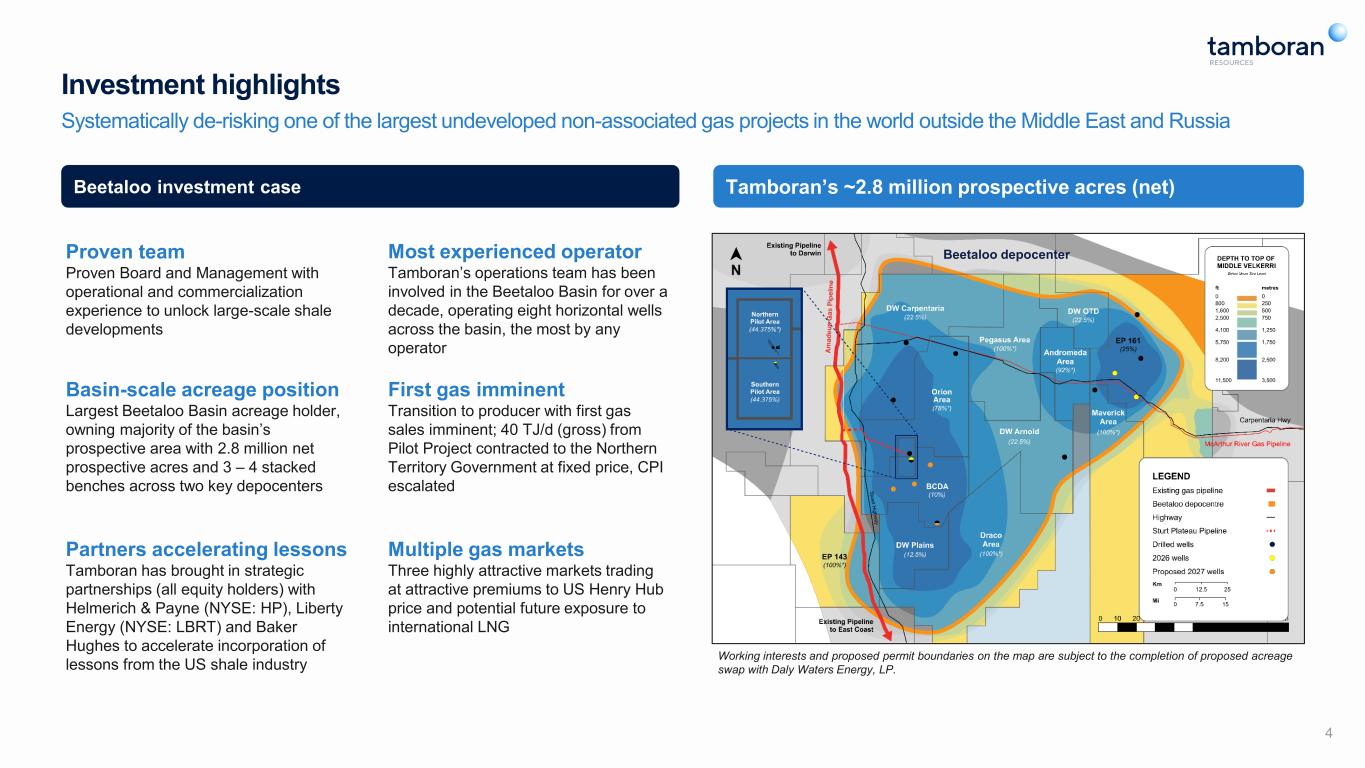
4 Investment highlights Systematically de-risking one of the largest undeveloped non-associated gas projects in the world outside the Middle East and Russia Beetaloo investment case Basin-scale acreage position Largest Beetaloo Basin acreage holder, owning majority of the basin’s prospective area with 2.8 million net prospective acres and 3 – 4 stacked benches across two key depocenters Multiple gas markets Three highly attractive markets trading at attractive premiums to US Henry Hub price and potential future exposure to international LNG First gas imminent Transition to producer with first gas sales imminent; 40 TJ/d (gross) from Pilot Project contracted to the Northern Territory Government at fixed price, CPI escalated Most experienced operator Tamboran’s operations team has been involved in the Beetaloo Basin for over a decade, operating eight horizontal wells across the basin, the most by any operator Proven team Proven Board and Management with operational and commercialization experience to unlock large-scale shale developments Partners accelerating lessons Tamboran has brought in strategic partnerships (all equity holders) with Helmerich & Payne (NYSE: HP), Liberty Energy (NYSE: LBRT) and Baker Hughes to accelerate incorporation of lessons from the US shale industry Tamboran’s ~2.8 million prospective acres (net) Beetaloo depocenter Working interests and proposed permit boundaries on the map are subject to the completion of proposed acreage swap with Daly Waters Energy, LP.

Company overview
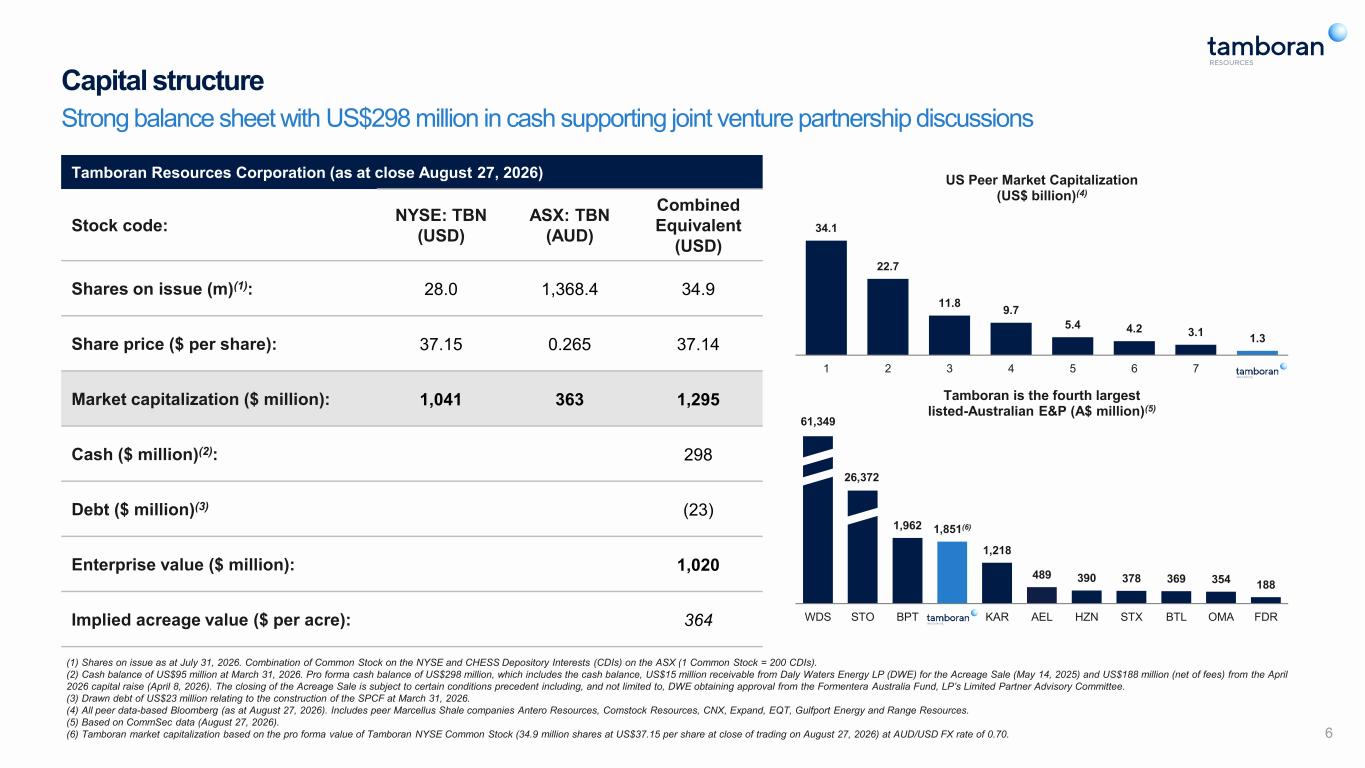
Tamboran Resources Corporation (as at close August 27, 2026) Stock code: NYSE: TBN (USD) ASX: TBN (AUD) Combined Equivalent (USD) Shares on issue (m)(1): 28.0 1,368.4 34.9 Share price ($ per share): 37.15 0.265 37.14 Market capitalization ($ million): 1,041 363 1,295 Cash ($ million)(2): 298 Debt ($ million)(3) (23) Enterprise value ($ million): 1,020 Implied acreage value ($ per acre): 364 6 (1) Shares on issue as at July 31, 2026. Combination of Common Stock on the NYSE and CHESS Depository Interests (CDIs) on the ASX (1 Common Stock = 200 CDIs). (2) Cash balance of US$95 million at March 31, 2026. Pro forma cash balance of US$298 million, which includes the cash balance, US$15 million receivable from Daly Waters Energy LP (DWE) for the Acreage Sale (May 14, 2025) and US$188 million (net of fees) from the April 2026 capital raise (April 8, 2026). The closing of the Acreage Sale is subject to certain conditions precedent including, and not limited to, DWE obtaining approval from the Formentera Australia Fund, LP’s Limited Partner Advisory Committee. (3) Drawn debt of US$23 million relating to the construction of the SPCF at March 31, 2026. (4) All peer data-based Bloomberg (as at August 27, 2026). Includes peer Marcellus Shale companies Antero Resources, Comstock Resources, CNX, Expand, EQT, Gulfport Energy and Range Resources. (5) Based on CommSec data (August 27, 2026). (6) Tamboran market capitalization based on the pro forma value of Tamboran NYSE Common Stock (34.9 million shares at US$37.15 per share at close of trading on August 27, 2026) at AUD/USD FX rate of 0.70. Capital structure Strong balance sheet with US$298 million in cash supporting joint venture partnership discussions 1,962 1,851(6) 1,218 489 390 378 369 354 188 WDS STO BPT KAR AEL HZN STX BTL OMA FDR Tamboran is the fourth largest listed-Australian E&P (A$ million)(5) 34.1 22.7 11.8 9.7 5.4 4.2 3.1 1.3 1 2 3 4 5 6 7 US Peer Market Capitalization (US$ billion)(4) 26,372 61,349
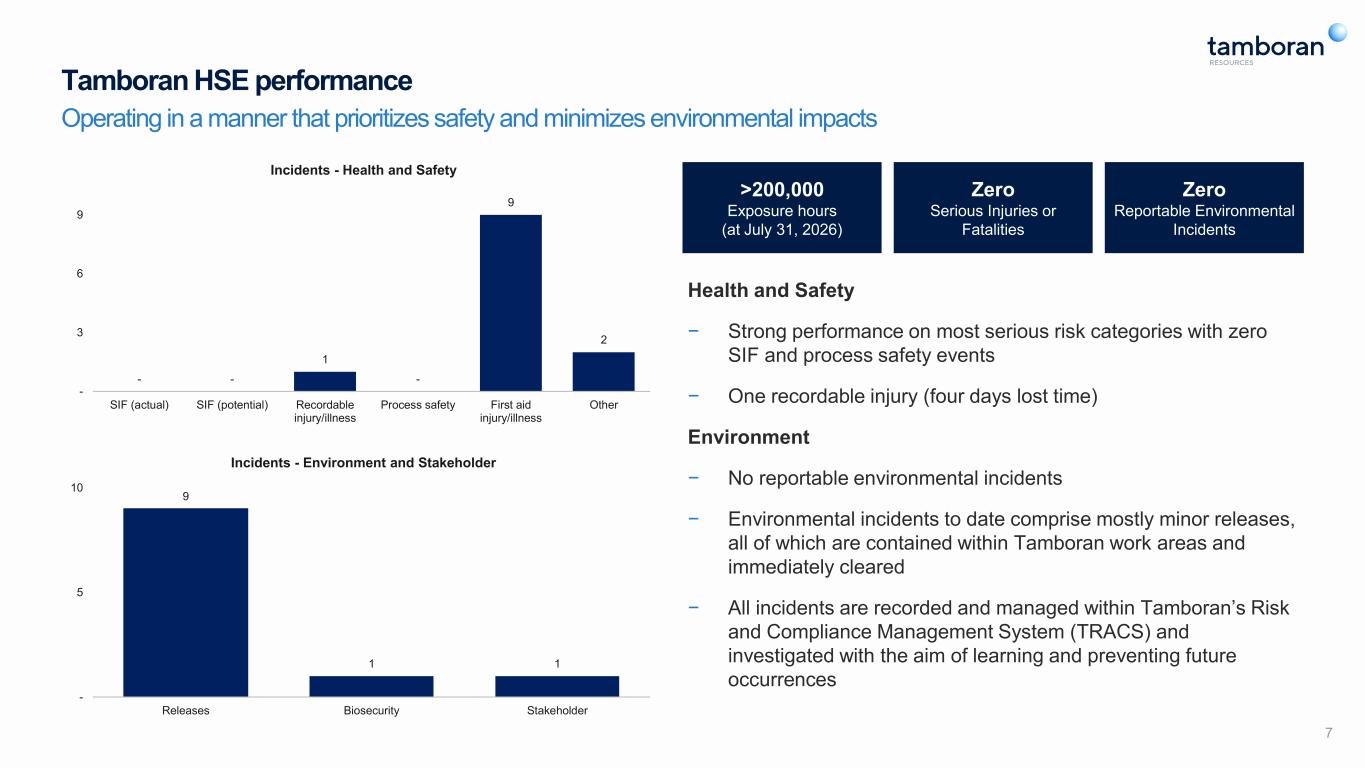
7 Tamboran HSE performance Operating in a manner that prioritizes safety and minimizes environmental impacts - - 1 - 9 2 - 3 6 9 SIF (actual) SIF (potential) Recordable injury/illness Process safety First aid injury/illness Other Incidents - Health and Safety 9 1 1 - 5 10 Releases Biosecurity Stakeholder Incidents - Environment and Stakeholder >200,000 Exposure hours (at July 31, 2026) Zero Serious Injuries or Fatalities Zero Reportable Environmental Incidents Health and Safety − Strong performance on most serious risk categories with zero SIF and process safety events − One recordable injury (four days lost time) Environment − No reportable environmental incidents − Environmental incidents to date comprise mostly minor releases, all of which are contained within Tamboran work areas and immediately cleared − All incidents are recorded and managed within Tamboran’s Risk and Compliance Management System (TRACS) and investigated with the aim of learning and preventing future occurrences
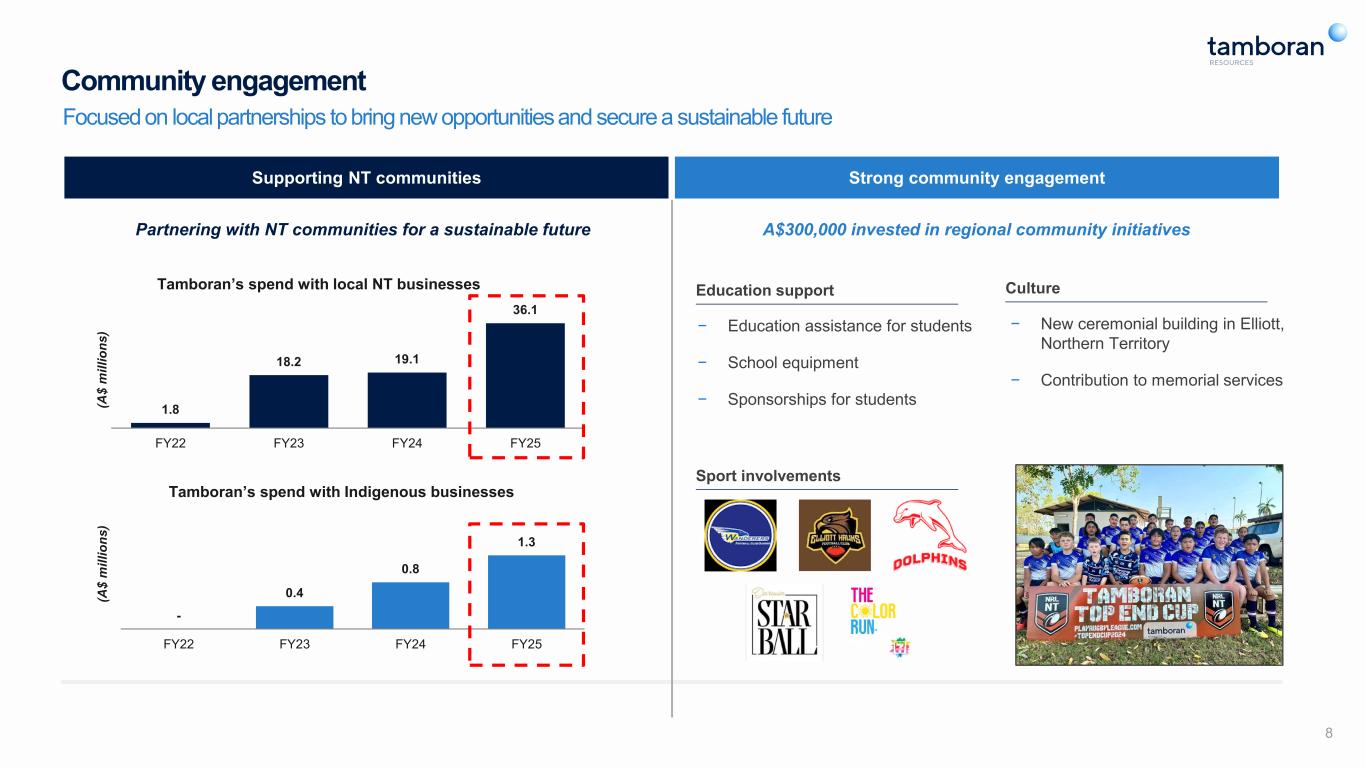
Supporting NT communities Strong community engagement - 0.4 0.8 1.3 FY22 FY23 FY24 FY25 (A $ m il li o n s ) Tamboran’s spend with Indigenous businesses 1.8 18.2 19.1 36.1 FY22 FY23 FY24 FY25 (A $ m il li o n s ) Tamboran’s spend with local NT businesses Community engagement Focused on local partnerships to bring new opportunities and secure a sustainable future Partnering with NT communities for a sustainable future A$300,000 invested in regional community initiatives Education support Culture Sport involvements − Education assistance for students − School equipment − Sponsorships for students − New ceremonial building in Elliott, Northern Territory − Contribution to memorial services 8
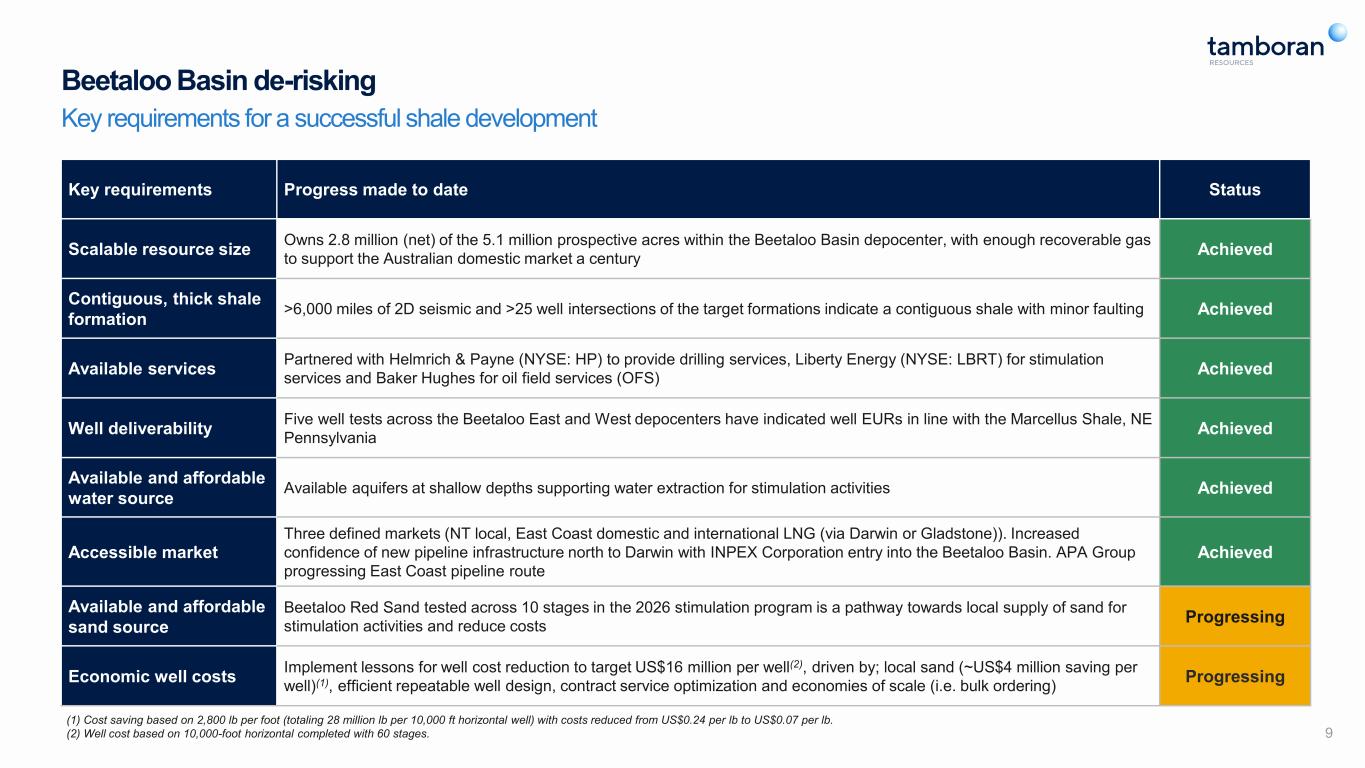
Beetaloo Basin de-risking Key requirements for a successful shale development 9 Key requirements Progress made to date Status Scalable resource size Owns 2.8 million (net) of the 5.1 million prospective acres within the Beetaloo Basin depocenter, with enough recoverable gas to support the Australian domestic market a century Achieved Contiguous, thick shale formation >6,000 miles of 2D seismic and >25 well intersections of the target formations indicate a contiguous shale with minor faulting Achieved Available services Partnered with Helmrich & Payne (NYSE: HP) to provide drilling services, Liberty Energy (NYSE: LBRT) for stimulation services and Baker Hughes for oil field services (OFS) Achieved Well deliverability Five well tests across the Beetaloo East and West depocenters have indicated well EURs in line with the Marcellus Shale, NE Pennsylvania Achieved Available and affordable water source Available aquifers at shallow depths supporting water extraction for stimulation activities Achieved Accessible market Three defined markets (NT local, East Coast domestic and international LNG (via Darwin or Gladstone)). Increased confidence of new pipeline infrastructure north to Darwin with INPEX Corporation entry into the Beetaloo Basin. APA Group progressing East Coast pipeline route Achieved Available and affordable sand source Beetaloo Red Sand tested across 10 stages in the 2026 stimulation program is a pathway towards local supply of sand for stimulation activities and reduce costs Progressing Economic well costs Implement lessons for well cost reduction to target US$16 million per well(2), driven by; local sand (~US$4 million saving per well)(1), efficient repeatable well design, contract service optimization and economies of scale (i.e. bulk ordering) Progressing (1) Cost saving based on 2,800 lb per foot (totaling 28 million lb per 10,000 ft horizontal well) with costs reduced from US$0.24 per lb to US$0.07 per lb. (2) Well cost based on 10,000-foot horizontal completed with 60 stages.
Proven team Proven Board and management team with history of successful shale development across multiple basins within the USA
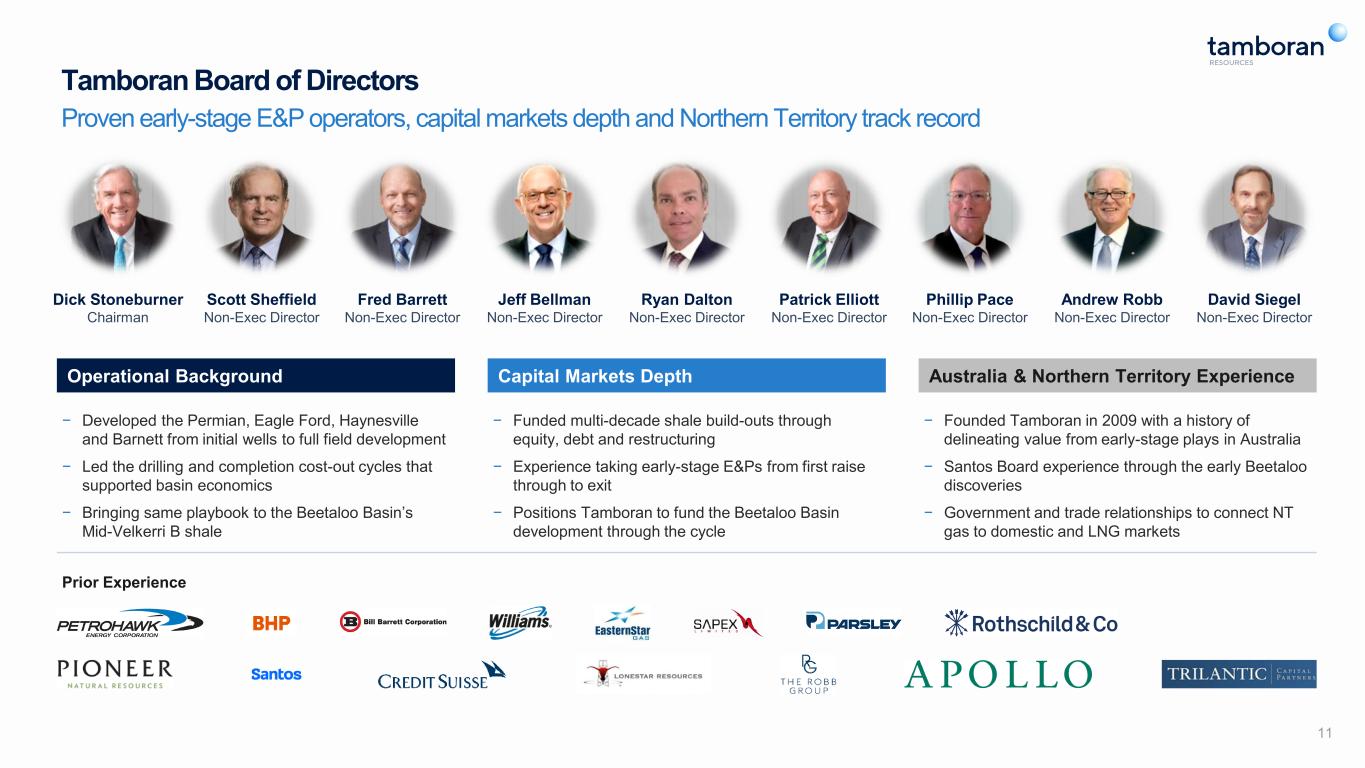
11 Dick Stoneburner Chairman Scott Sheffield Non-Exec Director Fred Barrett Non-Exec Director Jeff Bellman Non-Exec Director Ryan Dalton Non-Exec Director Patrick Elliott Non-Exec Director Phillip Pace Non-Exec Director Andrew Robb Non-Exec Director David Siegel Non-Exec Director Operational Background − Developed the Permian, Eagle Ford, Haynesville and Barnett from initial wells to full field development − Led the drilling and completion cost-out cycles that supported basin economics − Bringing same playbook to the Beetaloo Basin’s Mid-Velkerri B shale Capital Markets Depth − Funded multi-decade shale build-outs through equity, debt and restructuring − Experience taking early-stage E&Ps from first raise through to exit − Positions Tamboran to fund the Beetaloo Basin development through the cycle Australia & Northern Territory Experience − Founded Tamboran in 2009 with a history of delineating value from early-stage plays in Australia − Santos Board experience through the early Beetaloo discoveries − Government and trade relationships to connect NT gas to domestic and LNG markets Prior Experience Tamboran Board of Directors Proven early-stage E&P operators, capital markets depth and Northern Territory track record
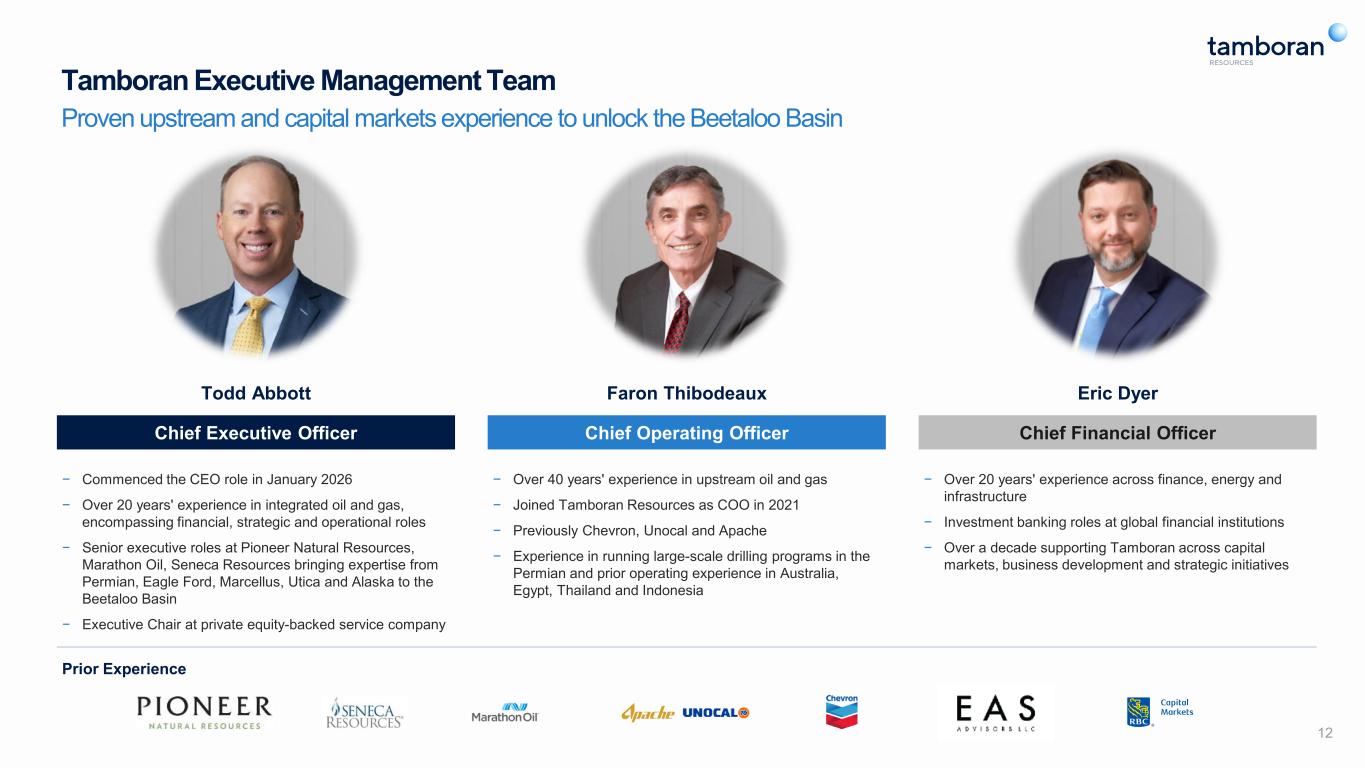
12 Todd Abbott Chief Executive Officer − Commenced the CEO role in January 2026 − Over 20 years' experience in integrated oil and gas, encompassing financial, strategic and operational roles − Senior executive roles at Pioneer Natural Resources, Marathon Oil, Seneca Resources bringing expertise from Permian, Eagle Ford, Marcellus, Utica and Alaska to the Beetaloo Basin − Executive Chair at private equity-backed service company Faron Thibodeaux Chief Operating Officer − Over 40 years' experience in upstream oil and gas − Joined Tamboran Resources as COO in 2021 − Previously Chevron, Unocal and Apache − Experience in running large-scale drilling programs in the Permian and prior operating experience in Australia, Egypt, Thailand and Indonesia Eric Dyer Chief Financial Officer − Over 20 years' experience across finance, energy and infrastructure − Investment banking roles at global financial institutions − Over a decade supporting Tamboran across capital markets, business development and strategic initiatives Prior Experience Tamboran Executive Management Team Proven upstream and capital markets experience to unlock the Beetaloo Basin
Geological overview Tamboran is the largest acreage holder in the Beetaloo Basin and the only working interest holder across the high-quality, contiguous shale resource in both the Beetaloo East and West depocenters
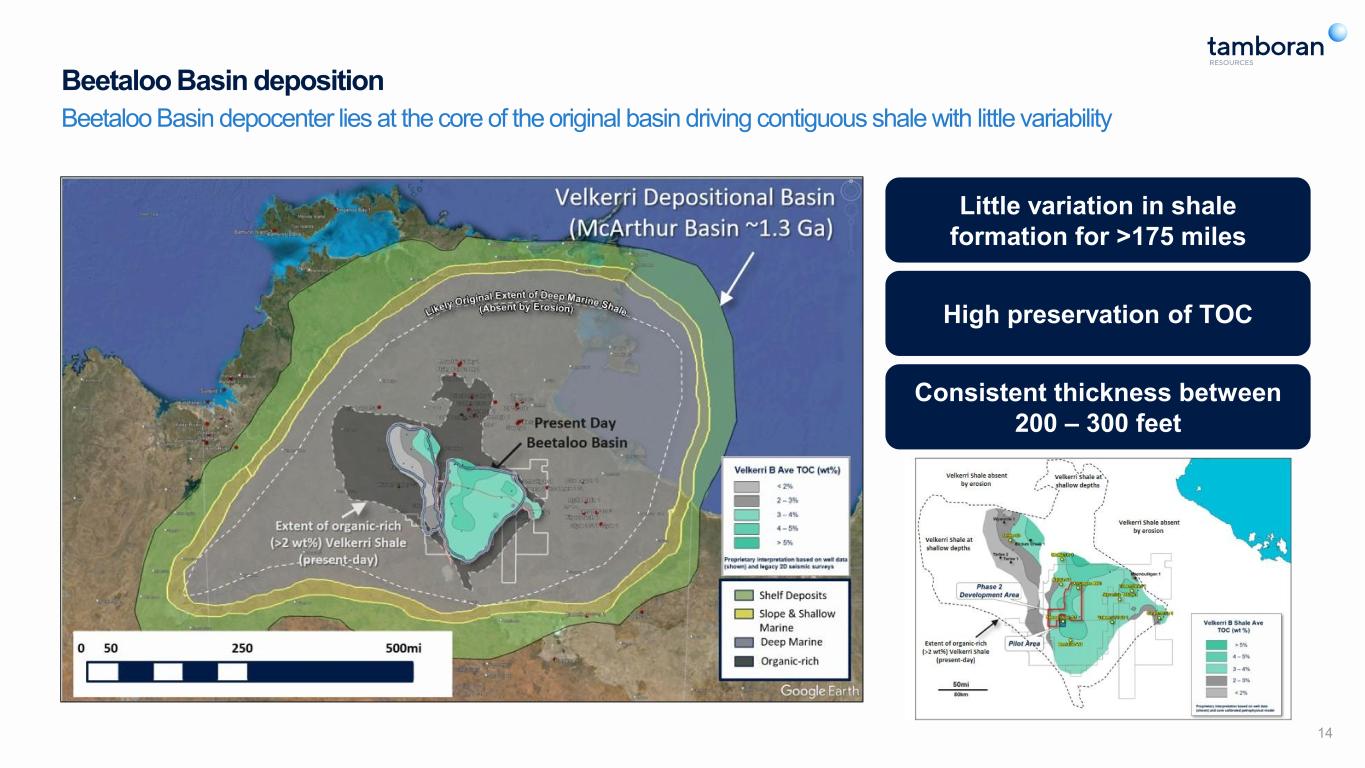
Beetaloo Basin deposition Beetaloo Basin depocenter lies at the core of the original basin driving contiguous shale with little variability 14 Little variation in shale formation for >175 miles High preservation of TOC Consistent thickness between 200 – 300 feet
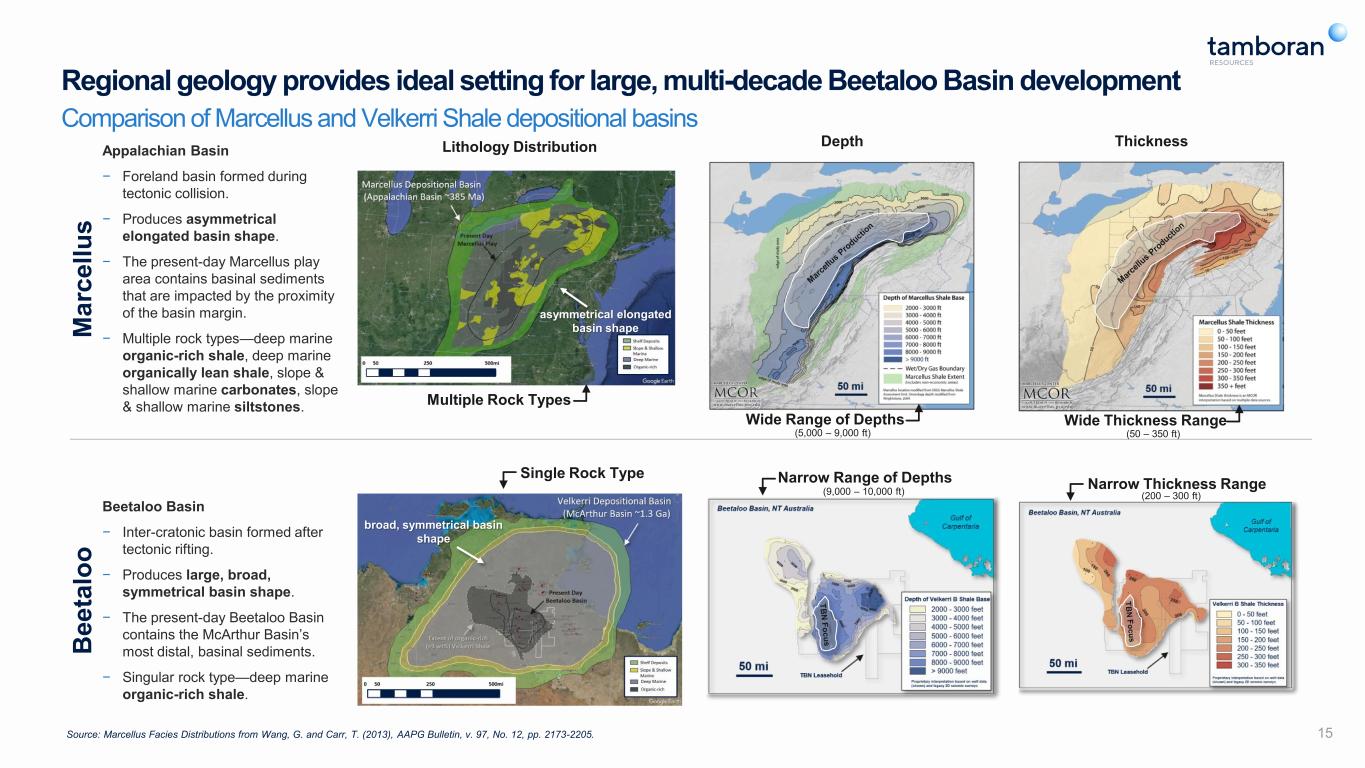
15 M a rc e ll u s B e e ta lo o Appalachian Basin − Foreland basin formed during tectonic collision. − Produces asymmetrical elongated basin shape. − The present-day Marcellus play area contains basinal sediments that are impacted by the proximity of the basin margin. − Multiple rock types—deep marine organic-rich shale, deep marine organically lean shale, slope & shallow marine carbonates, slope & shallow marine siltstones. Beetaloo Basin − Inter-cratonic basin formed after tectonic rifting. − Produces large, broad, symmetrical basin shape. − The present-day Beetaloo Basin contains the McArthur Basin’s most distal, basinal sediments. − Singular rock type—deep marine organic-rich shale. asymmetrical elongated basin shape Multiple Rock Types broad, symmetrical basin shape Single Rock Type Lithology Distribution Depth Thickness Wide Range of Depths (5,000 – 9,000 ft) Wide Thickness Range (50 – 350 ft) Narrow Range of Depths (9,000 – 10,000 ft) Narrow Thickness Range (200 – 300 ft) Regional geology provides ideal setting for large, multi-decade Beetaloo Basin development Comparison of Marcellus and Velkerri Shale depositional basins Source: Marcellus Facies Distributions from Wang, G. and Carr, T. (2013), AAPG Bulletin, v. 97, No. 12, pp. 2173-2205.
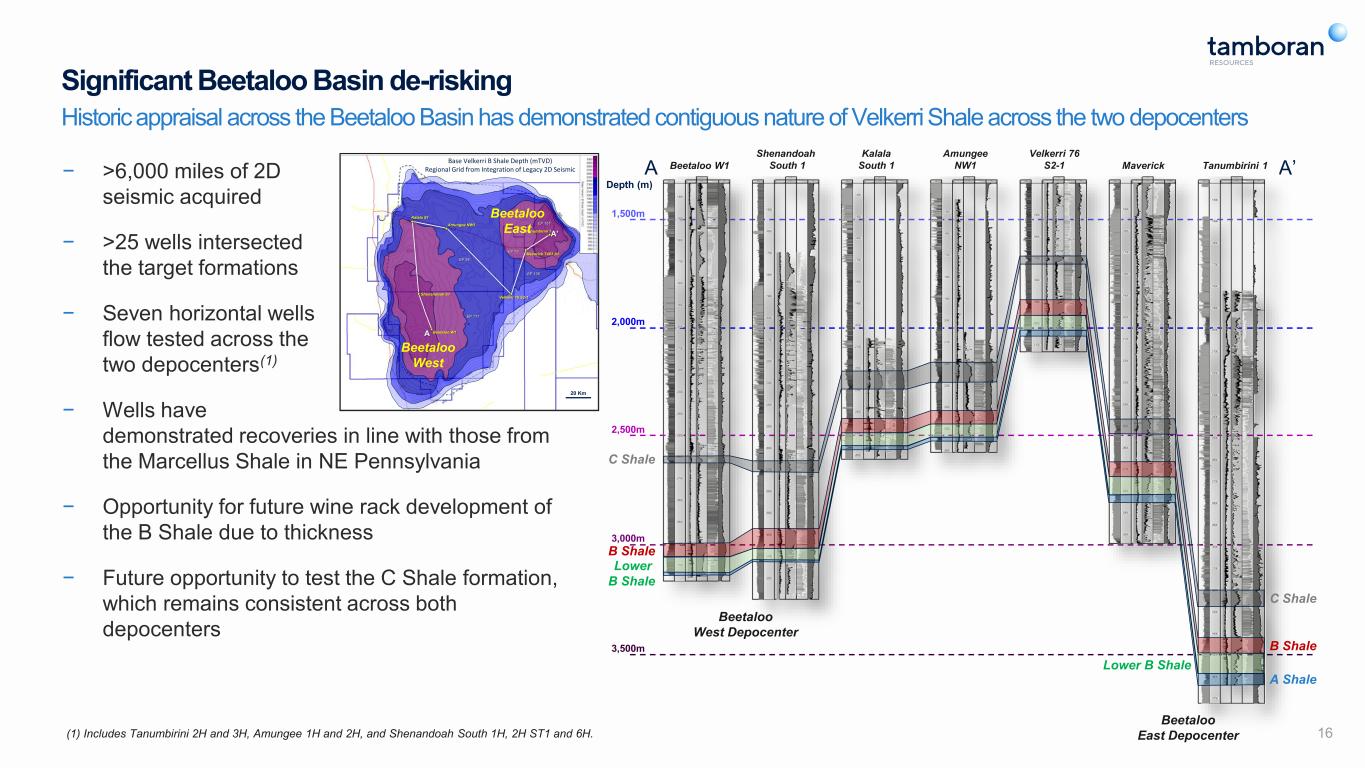
Significant Beetaloo Basin de-risking Historic appraisal across the Beetaloo Basin has demonstrated contiguous nature of Velkerri Shale across the two depocenters 16 − >6,000 miles of 2D seismic acquired − >25 wells intersected the target formations − Seven horizontal wells flow tested across the two depocenters(1) − Wells have demonstrated recoveries in line with those from the Marcellus Shale in NE Pennsylvania − Opportunity for future wine rack development of the B Shale due to thickness − Future opportunity to test the C Shale formation, which remains consistent across both depocenters (1) Includes Tanumbirini 2H and 3H, Amungee 1H and 2H, and Shenandoah South 1H, 2H ST1 and 6H. 1,500m 2,000m 2,500m 3,000m 3,500m A A’ Depth (m) Beetaloo W1 Shenandoah South 1 Kalala South 1 Amungee NW1 Velkerri 76 S2-1 Maverick Tanumbirini 1 C Shale C Shale B Shale B Shale Lower B Shale Lower B Shale A Shale A Shale EP 98 EP 117 EP 136 EP 161 EP 76 20 Km A A’ Base Velkerri B Shale Depth (mTVD) Regional Grid from Integration of Legacy 2D Seismic Beetaloo W1 Shenandoah S1 Kalala S1 Amungee NW1 Velkerri 76 S2-1 Maverick T463 A1 Tanumbirini 1 Beetaloo West Beetaloo East Beetaloo West Depocenter Beetaloo East Depocenter
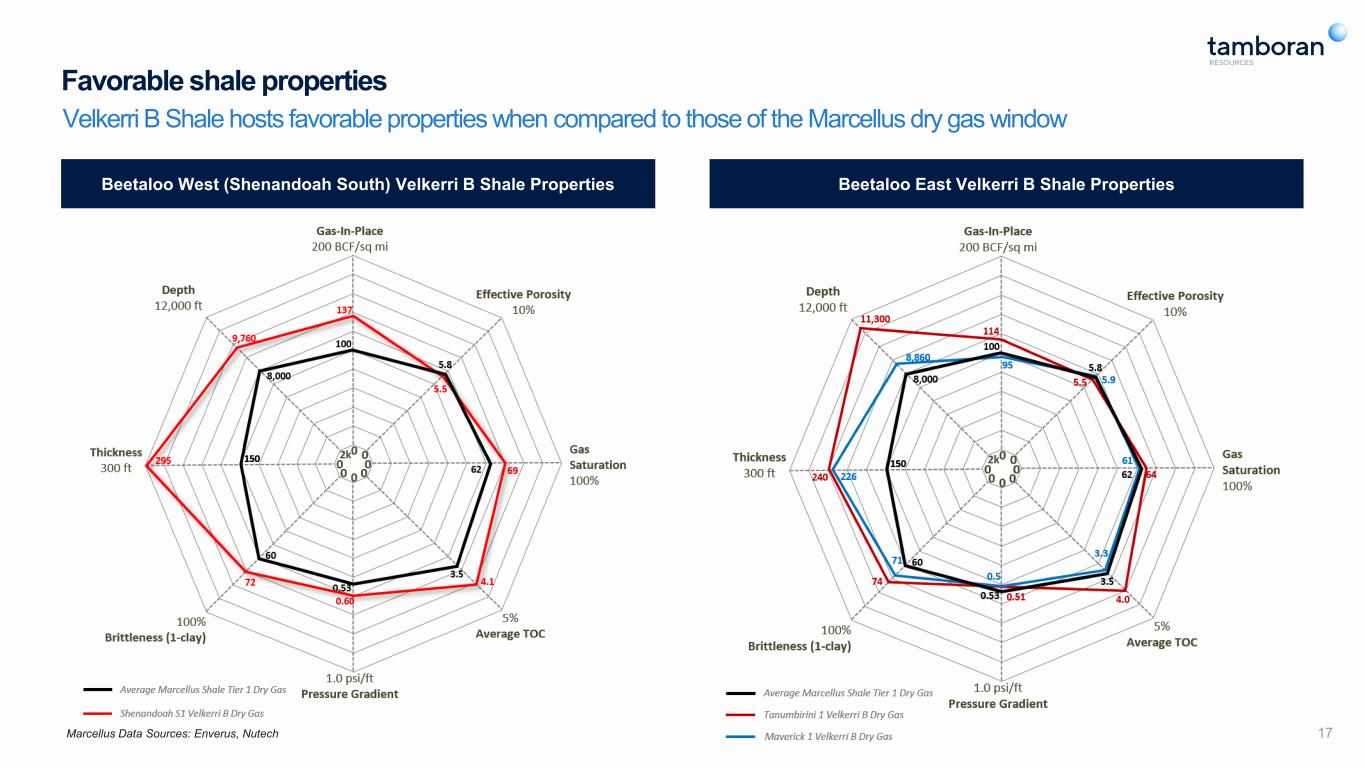
17 Favorable shale properties Velkerri B Shale hosts favorable properties when compared to those of the Marcellus dry gas window Beetaloo West (Shenandoah South) Velkerri B Shale Properties Beetaloo East Velkerri B Shale Properties Marcellus Data Sources: Enverus, Nutech
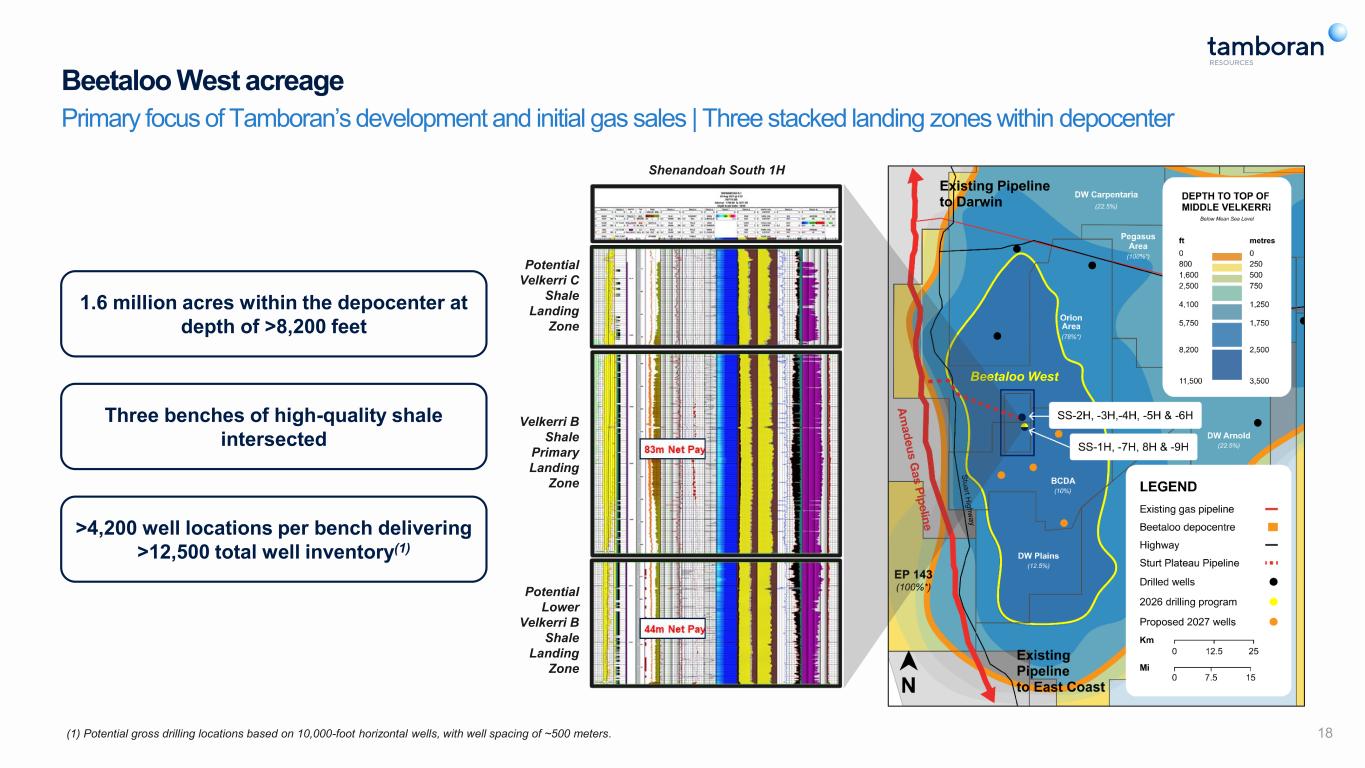
Beetaloo West Beetaloo West acreage Primary focus of Tamboran’s development and initial gas sales | Three stacked landing zones within depocenter 18 Shenandoah South 1H Potential Velkerri C Shale Landing Zone Velkerri B Shale Primary Landing Zone Potential Lower Velkerri B Shale Landing Zone (1) Potential gross drilling locations based on 10,000-foot horizontal wells, with well spacing of ~500 meters. 1.6 million acres within the depocenter at depth of >8,200 feet Three benches of high-quality shale intersected >4,200 well locations per bench delivering >12,500 total well inventory(1)
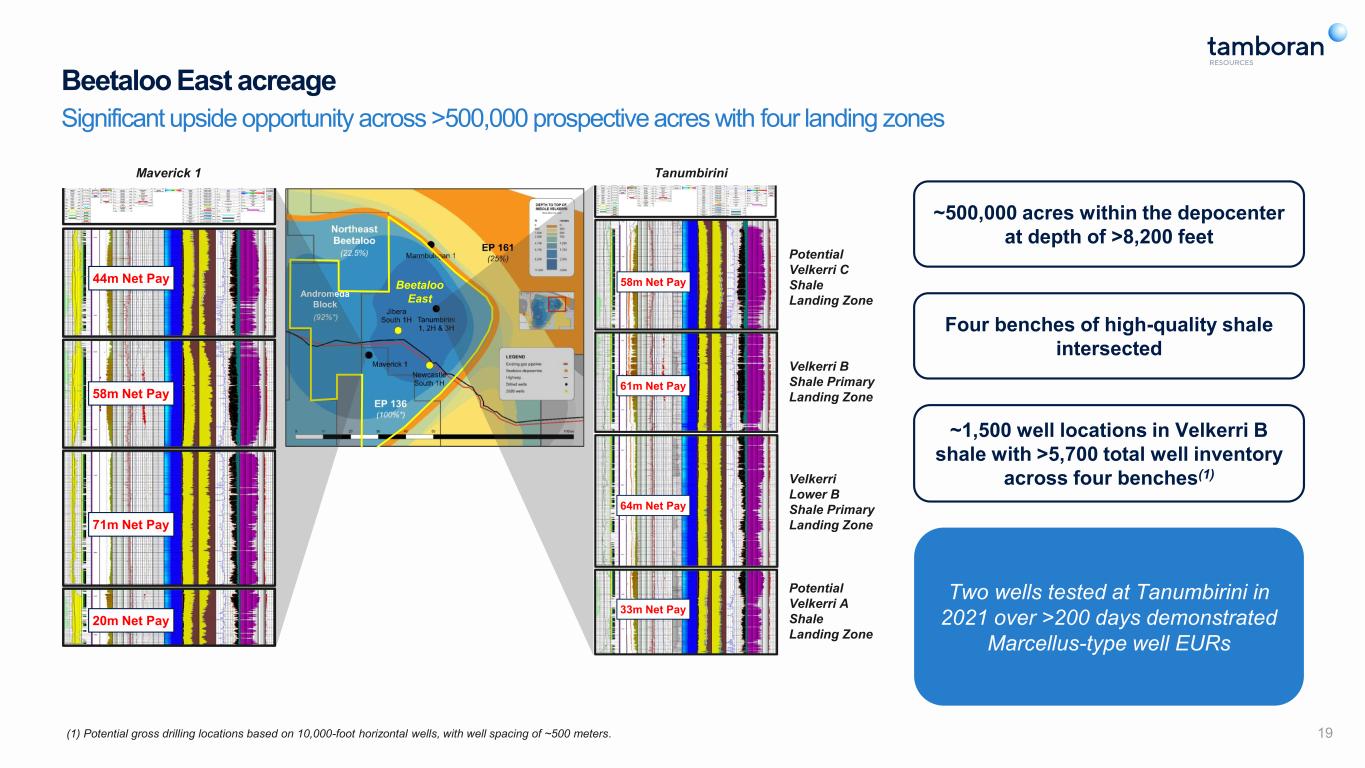
Beetaloo East acreage Significant upside opportunity across >500,000 prospective acres with four landing zones Shenandoah South 2 well pad in the Northern Pilot Area, Beetaloo Basin 19 Potential Velkerri C Shale Landing Zone Velkerri B Shale Primary Landing Zone Potential Velkerri A Shale Landing Zone Velkerri Lower B Shale Primary Landing Zone ~500,000 acres within the depocenter at depth of >8,200 feet Four benches of high-quality shale intersected ~1,500 well locations in Velkerri B shale with >5,700 total well inventory across four benches(1) Two wells tested at Tanumbirini in 2021 over >200 days demonstrated Marcellus-type well EURs B shale (B2) Primary Landing Zone C shale (C1) Additional Upside Landing Zone L. B shale (B3) Additional Upside Landing Zone 61m Net Pay 64m Net Pay 33m Net Pay 58m Net Pay A shale (A1) Potential Upside Landing Zone Tanumbirini 1 (2016)Maverick 1 (2022) 58m Net Pay 71m Net Pay 20m Net Pay 44m Net Pay B shale (B2) Primary Landing Zone C shale (C1) Additional Upside Landing Zone L. B shale (B3) Additional Upside Landing Zone A shale (A1) Potential Upside Landing Zone Tanumbirini Andromeda Block Maverick 1 Beetaloo East (1) Potential gross drilling locations based on 10,000-foot horizontal wells, with well spacing of ~500 meters.
Strategic partnerships and local resources Tamboran has secured strategic partnerships with important onshore US shale service providers H&P, Liberty and Baker Hughes to accelerate applications of modern well design into the Beetaloo Basin
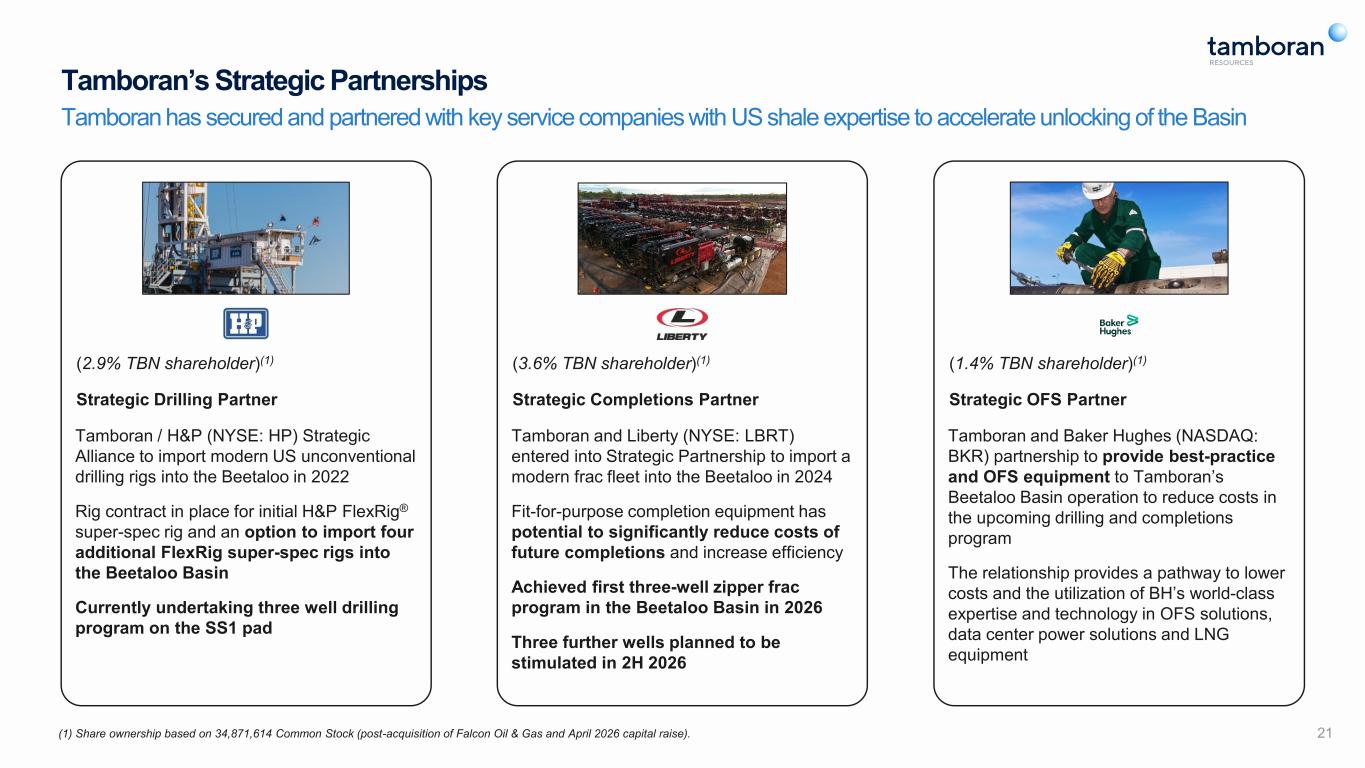
Tamboran’s Strategic Partnerships Tamboran has secured and partnered with key service companies with US shale expertise to accelerate unlocking of the Basin 21 (2.9% TBN shareholder)(1) Strategic Drilling Partner Tamboran / H&P (NYSE: HP) Strategic Alliance to import modern US unconventional drilling rigs into the Beetaloo in 2022 Rig contract in place for initial H&P FlexRig® super-spec rig and an option to import four additional FlexRig super-spec rigs into the Beetaloo Basin Currently undertaking three well drilling program on the SS1 pad (3.6% TBN shareholder)(1) Strategic Completions Partner Tamboran and Liberty (NYSE: LBRT) entered into Strategic Partnership to import a modern frac fleet into the Beetaloo in 2024 Fit-for-purpose completion equipment has potential to significantly reduce costs of future completions and increase efficiency Achieved first three-well zipper frac program in the Beetaloo Basin in 2026 Three further wells planned to be stimulated in 2H 2026 (1.4% TBN shareholder)(1) Strategic OFS Partner Tamboran and Baker Hughes (NASDAQ: BKR) partnership to provide best-practice and OFS equipment to Tamboran’s Beetaloo Basin operation to reduce costs in the upcoming drilling and completions program The relationship provides a pathway to lower costs and the utilization of BH’s world-class expertise and technology in OFS solutions, data center power solutions and LNG equipment (1) Share ownership based on 34,871,614 Common Stock (post-acquisition of Falcon Oil & Gas and April 2026 capital raise).
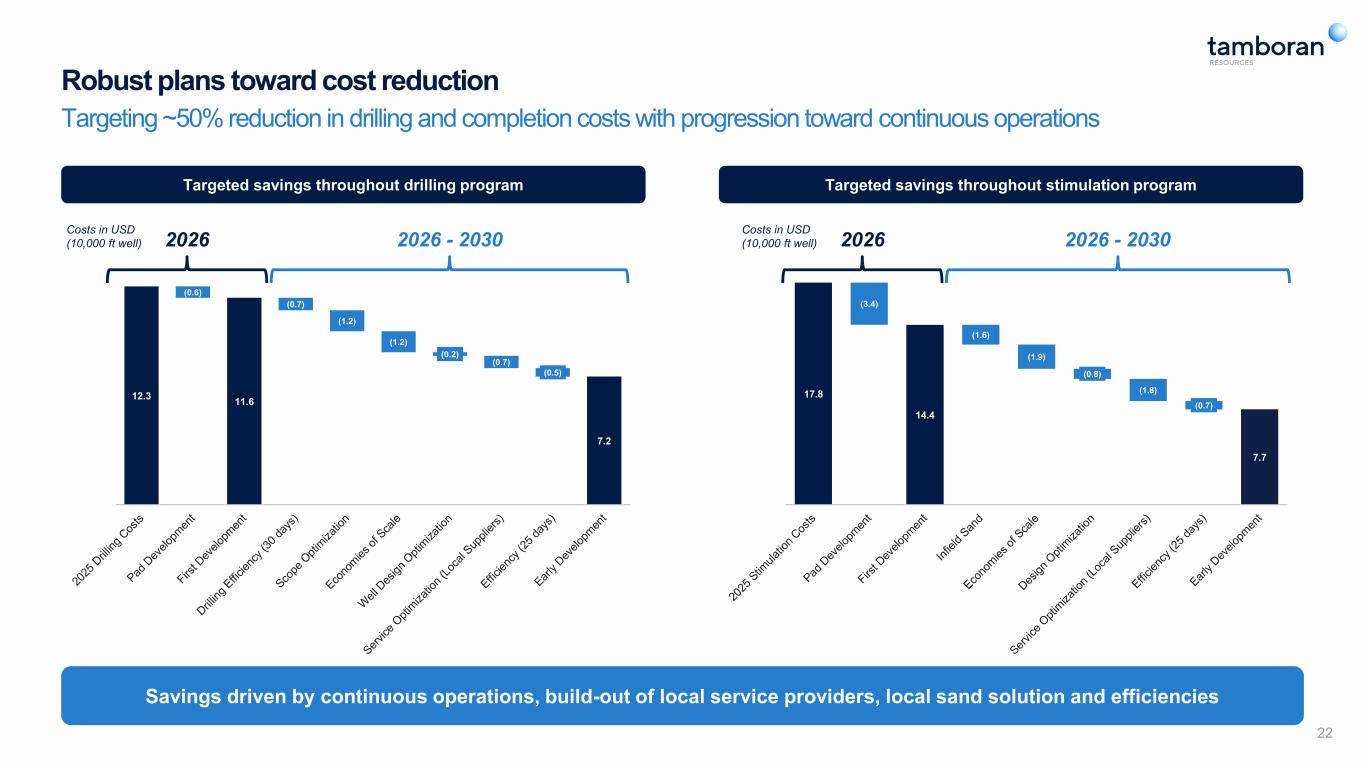
11.6 7.2 (0.6) (0.7) (1.2) (1.2) (0.2) (0.7) (0.5) 12.3 Robust plans toward cost reduction Targeting ~50% reduction in drilling and completion costs with progression toward continuous operations 2026 2026 - 2030 Costs in USD (10,000 ft well) 14.4 7.7 (3.4) (1.6) (1.9) (0.8) (1.8) (0.7) 17.8 2026 2026 - 2030 Costs in USD (10,000 ft well) Targeted savings throughout stimulation programTargeted savings throughout drilling program Savings driven by continuous operations, build-out of local service providers, local sand solution and efficiencies 22
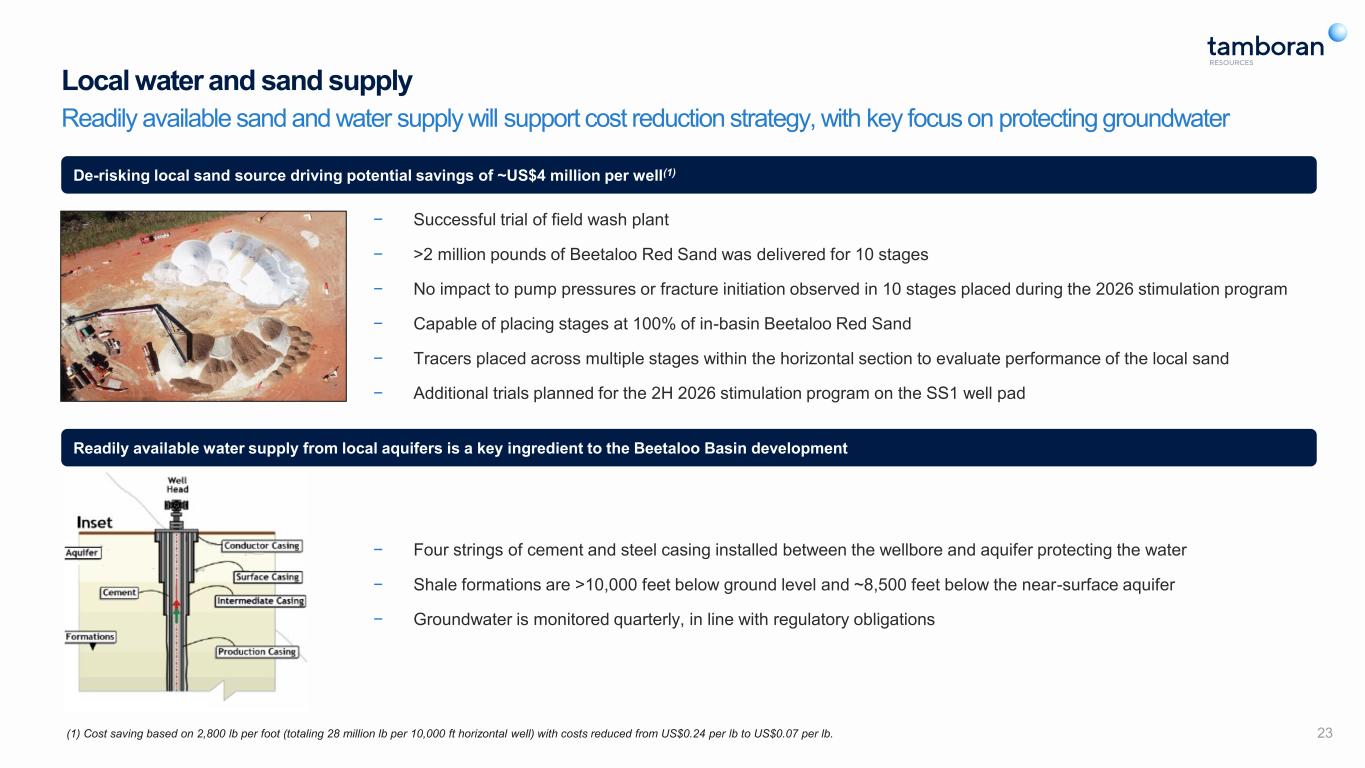
Local water and sand supply Readily available sand and water supply will support cost reduction strategy, with key focus on protecting groundwater Shenandoah South 2 well pad in the Northern Pilot Area, Beetaloo Basin 23 − Successful trial of field wash plant − >2 million pounds of Beetaloo Red Sand was delivered for 10 stages − No impact to pump pressures or fracture initiation observed in 10 stages placed during the 2026 stimulation program − Capable of placing stages at 100% of in-basin Beetaloo Red Sand − Tracers placed across multiple stages within the horizontal section to evaluate performance of the local sand − Additional trials planned for the 2H 2026 stimulation program on the SS1 well pad (1) Cost saving based on 2,800 lb per foot (totaling 28 million lb per 10,000 ft horizontal well) with costs reduced from US$0.24 per lb to US$0.07 per lb. De-risking local sand source driving potential savings of ~US$4 million per well(1) Readily available water supply from local aquifers is a key ingredient to the Beetaloo Basin development − Four strings of cement and steel casing installed between the wellbore and aquifer protecting the water − Shale formations are >10,000 feet below ground level and ~8,500 feet below the near-surface aquifer − Groundwater is monitored quarterly, in line with regulatory obligations
Shenandoah South Pilot Project Tamboran has progressed the Beetaloo Basin from exploration into first gas sales, with pilot volumes to provide long-term flow testing of Mid-Velkerri B Shale and deliver accelerated royalties to Native Title Holders and Northern Territory Government
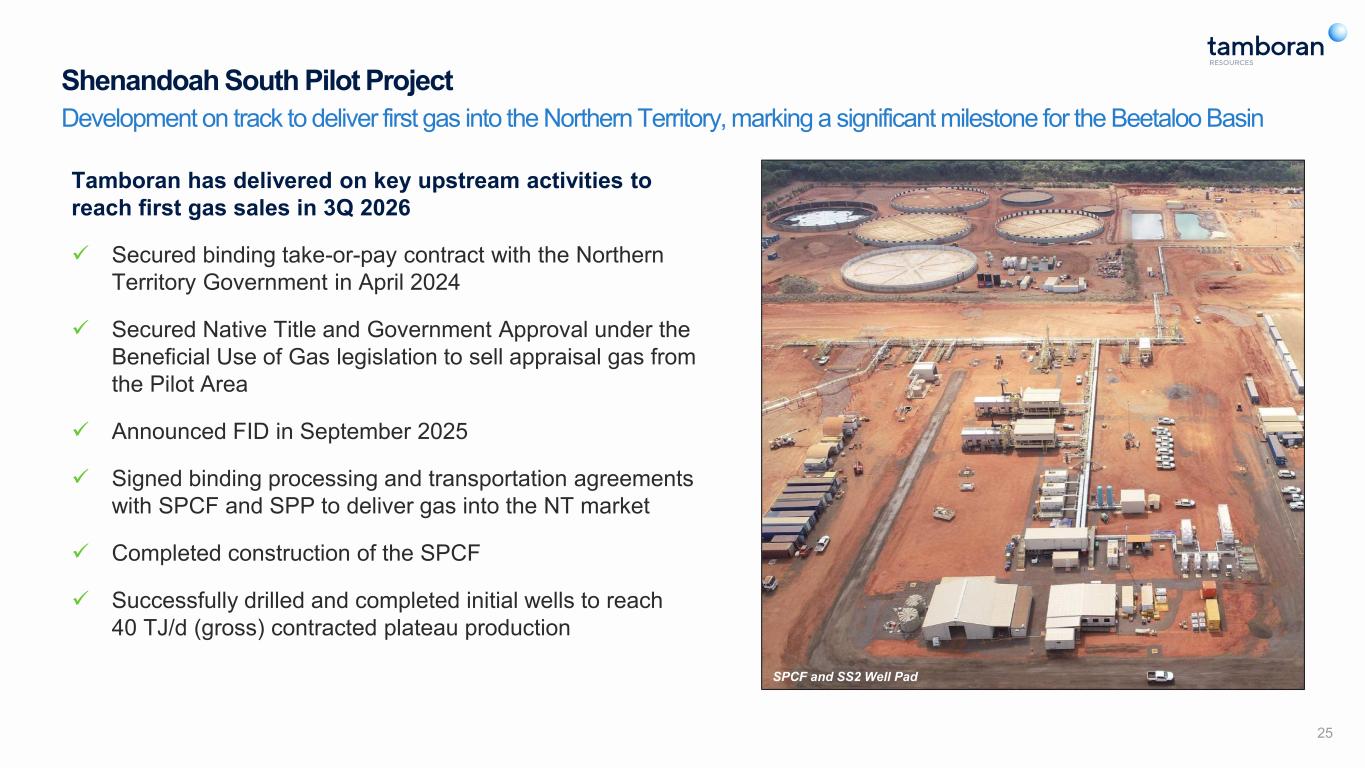
Shenandoah South Pilot Project Development on track to deliver first gas into the Northern Territory, marking a significant milestone for the Beetaloo Basin 25 Tamboran has delivered on key upstream activities to reach first gas sales in 3Q 2026 ✓ Secured binding take-or-pay contract with the Northern Territory Government in April 2024 ✓ Secured Native Title and Government Approval under the Beneficial Use of Gas legislation to sell appraisal gas from the Pilot Area ✓ Announced FID in September 2025 ✓ Signed binding processing and transportation agreements with SPCF and SPP to deliver gas into the NT market ✓ Completed construction of the SPCF ✓ Successfully drilled and completed initial wells to reach 40 TJ/d (gross) contracted plateau production SPCF and SS2 Well Pad
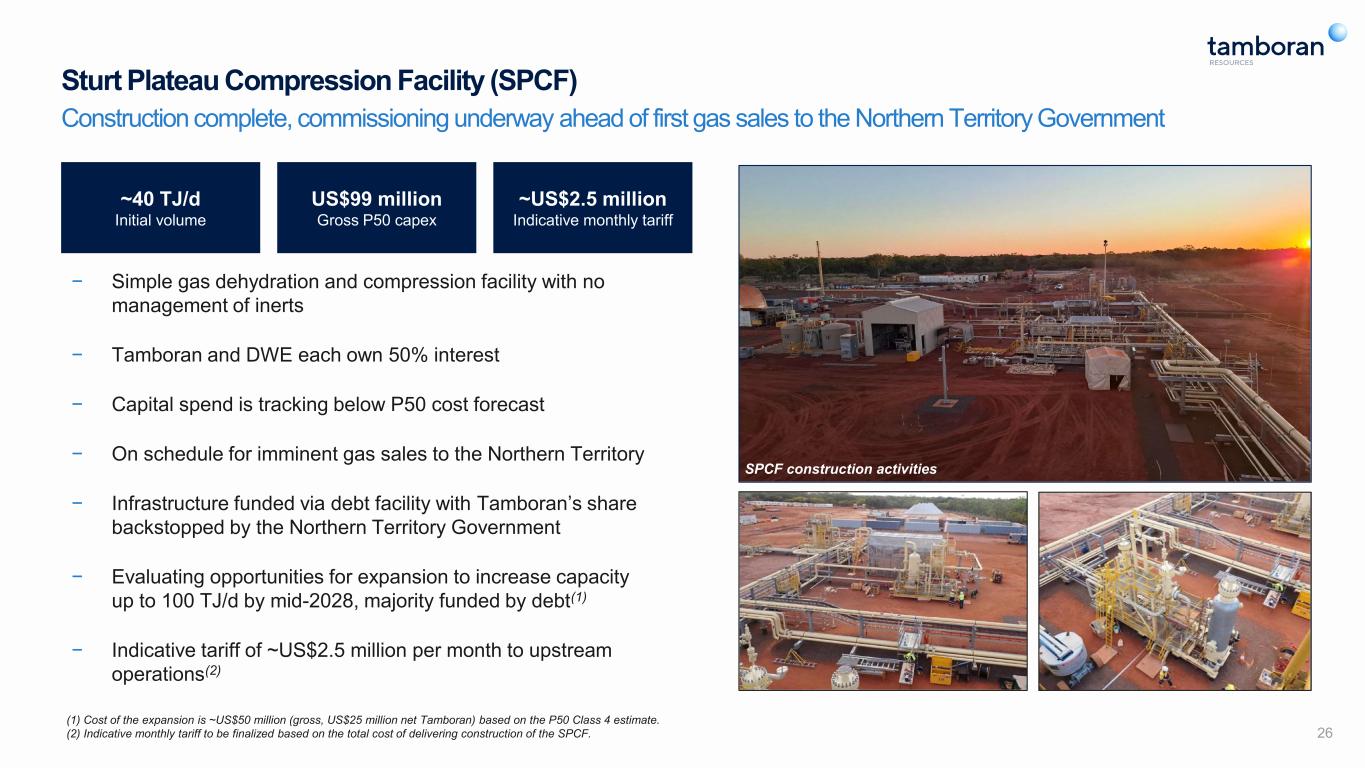
Sturt Plateau Compression Facility (SPCF) Construction complete, commissioning underway ahead of first gas sales to the Northern Territory Government − Simple gas dehydration and compression facility with no management of inerts − Tamboran and DWE each own 50% interest − Capital spend is tracking below P50 cost forecast − On schedule for imminent gas sales to the Northern Territory − Infrastructure funded via debt facility with Tamboran’s share backstopped by the Northern Territory Government − Evaluating opportunities for expansion to increase capacity up to 100 TJ/d by mid-2028, majority funded by debt(1) − Indicative tariff of ~US$2.5 million per month to upstream operations(2) (1) Cost of the expansion is ~US$50 million (gross, US$25 million net Tamboran) based on the P50 Class 4 estimate. (2) Indicative monthly tariff to be finalized based on the total cost of delivering construction of the SPCF. 26 SPCF construction activities ~40 TJ/d Initial volume US$99 million Gross P50 capex ~US$2.5 million Indicative monthly tariff
Multiple gas markets Three highly attractive markets trading at premiums to US Henry Hub price and potential future exposure to international LNG provides optionality to future commercialization
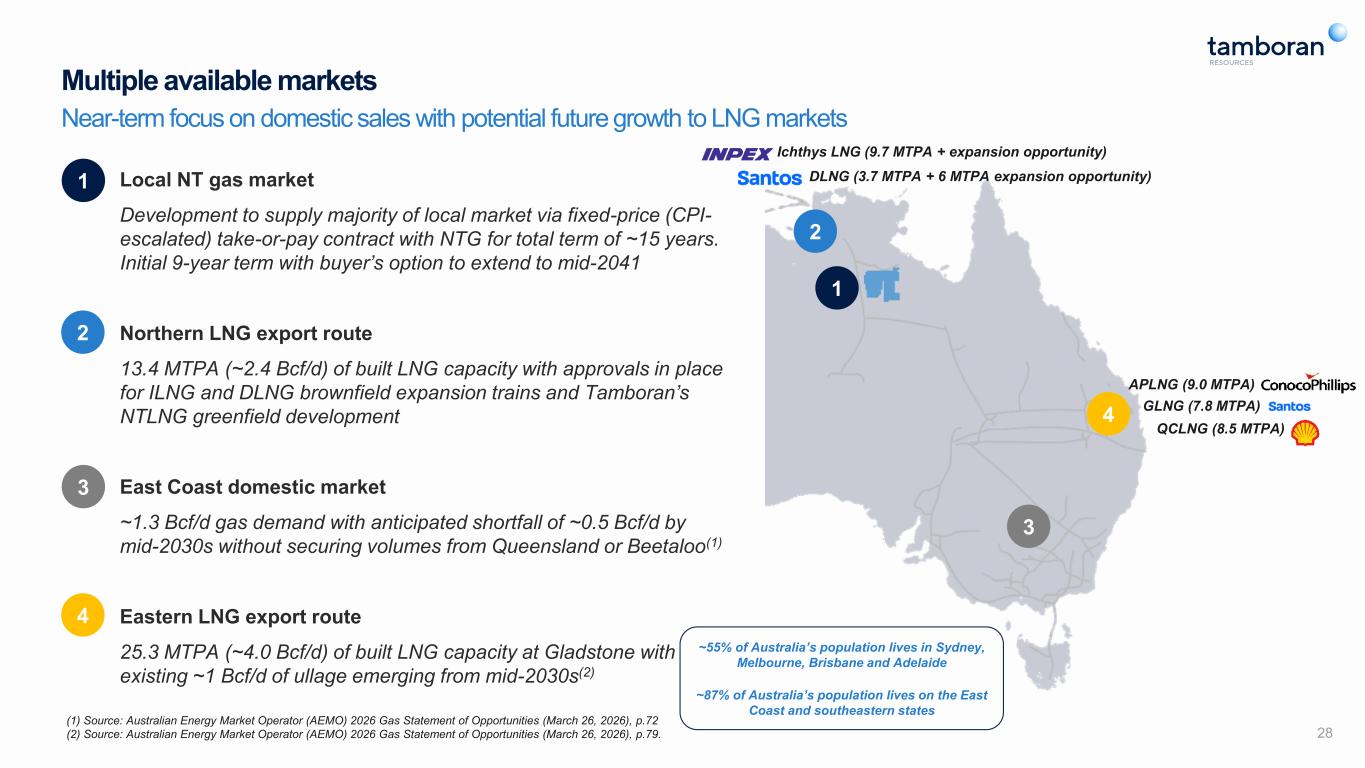
Multiple available markets Near-term focus on domestic sales with potential future growth to LNG markets 3 1 Local NT gas market Development to supply majority of local market via fixed-price (CPI- escalated) take-or-pay contract with NTG for total term of ~15 years. Initial 9-year term with buyer’s option to extend to mid-2041 Northern LNG export route 13.4 MTPA (~2.4 Bcf/d) of built LNG capacity with approvals in place for ILNG and DLNG brownfield expansion trains and Tamboran’s NTLNG greenfield development East Coast domestic market ~1.3 Bcf/d gas demand with anticipated shortfall of ~0.5 Bcf/d by mid-2030s without securing volumes from Queensland or Beetaloo(1) Eastern LNG export route 25.3 MTPA (~4.0 Bcf/d) of built LNG capacity at Gladstone with existing ~1 Bcf/d of ullage emerging from mid-2030s(2) 2 4 (1) Source: Australian Energy Market Operator (AEMO) 2026 Gas Statement of Opportunities (March 26, 2026), p.72 (2) Source: Australian Energy Market Operator (AEMO) 2026 Gas Statement of Opportunities (March 26, 2026), p.79. 28 ~55% of Australia’s population lives in Sydney, Melbourne, Brisbane and Adelaide ~87% of Australia’s population lives on the East Coast and southeastern states 1 2 3 4 Ichthys LNG (9.7 MTPA + expansion opportunity) DLNG (3.7 MTPA + 6 MTPA expansion opportunity) APLNG (9.0 MTPA) GLNG (7.8 MTPA) QCLNG (8.5 MTPA)
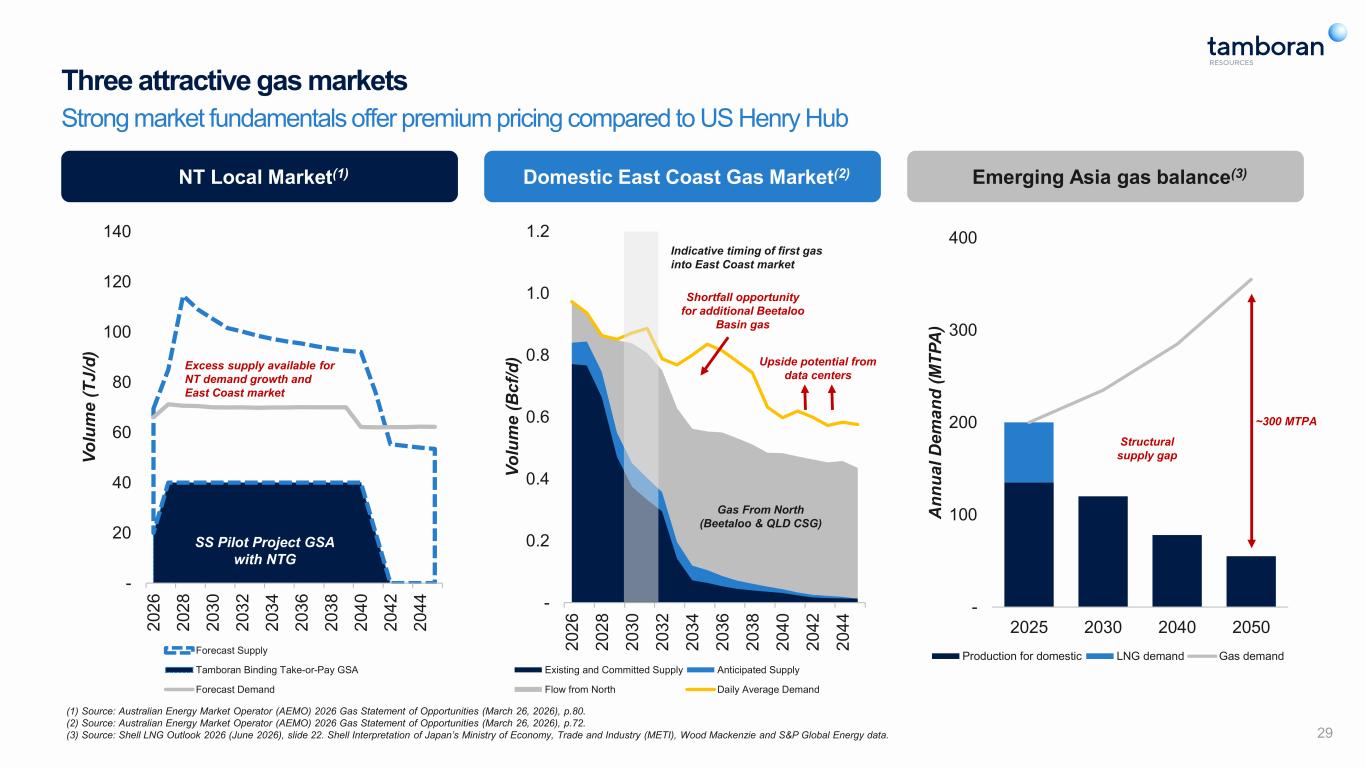
Three attractive gas markets Strong market fundamentals offer premium pricing compared to US Henry Hub 29 - 20 40 60 80 100 120 140 2 0 2 6 2 0 2 8 2 0 3 0 2 0 3 2 2 0 3 4 2 0 3 6 2 0 3 8 2 0 4 0 2 0 4 2 2 0 4 4 V o lu m e ( T J /d ) Forecast Supply Tamboran Binding Take-or-Pay GSA Forecast Demand NT Local Market(1) SS Pilot Project GSA with NTG (1) Source: Australian Energy Market Operator (AEMO) 2026 Gas Statement of Opportunities (March 26, 2026), p.80. (2) Source: Australian Energy Market Operator (AEMO) 2026 Gas Statement of Opportunities (March 26, 2026), p.72. (3) Source: Shell LNG Outlook 2026 (June 2026), slide 22. Shell Interpretation of Japan’s Ministry of Economy, Trade and Industry (METI), Wood Mackenzie and S&P Global Energy data. Excess supply available for NT demand growth and East Coast market Domestic East Coast Gas Market(2) Emerging Asia gas balance(3) - 0.2 0.4 0.6 0.8 1.0 1.2 2 0 2 6 2 0 2 8 2 0 3 0 2 0 3 2 2 0 3 4 2 0 3 6 2 0 3 8 2 0 4 0 2 0 4 2 2 0 4 4 V o lu m e ( B c f/ d ) Existing and Committed Supply Anticipated Supply Flow from North Daily Average Demand Shortfall opportunity for additional Beetaloo Basin gas Indicative timing of first gas into East Coast market - 100 200 300 400 2025 2030 2040 2050 A n n u a l D e m a n d ( M T P A ) Production for domestic LNG demand Gas demand Structural supply gap ~300 MTPA Gas From North (Beetaloo & QLD CSG) Upside potential from data centers
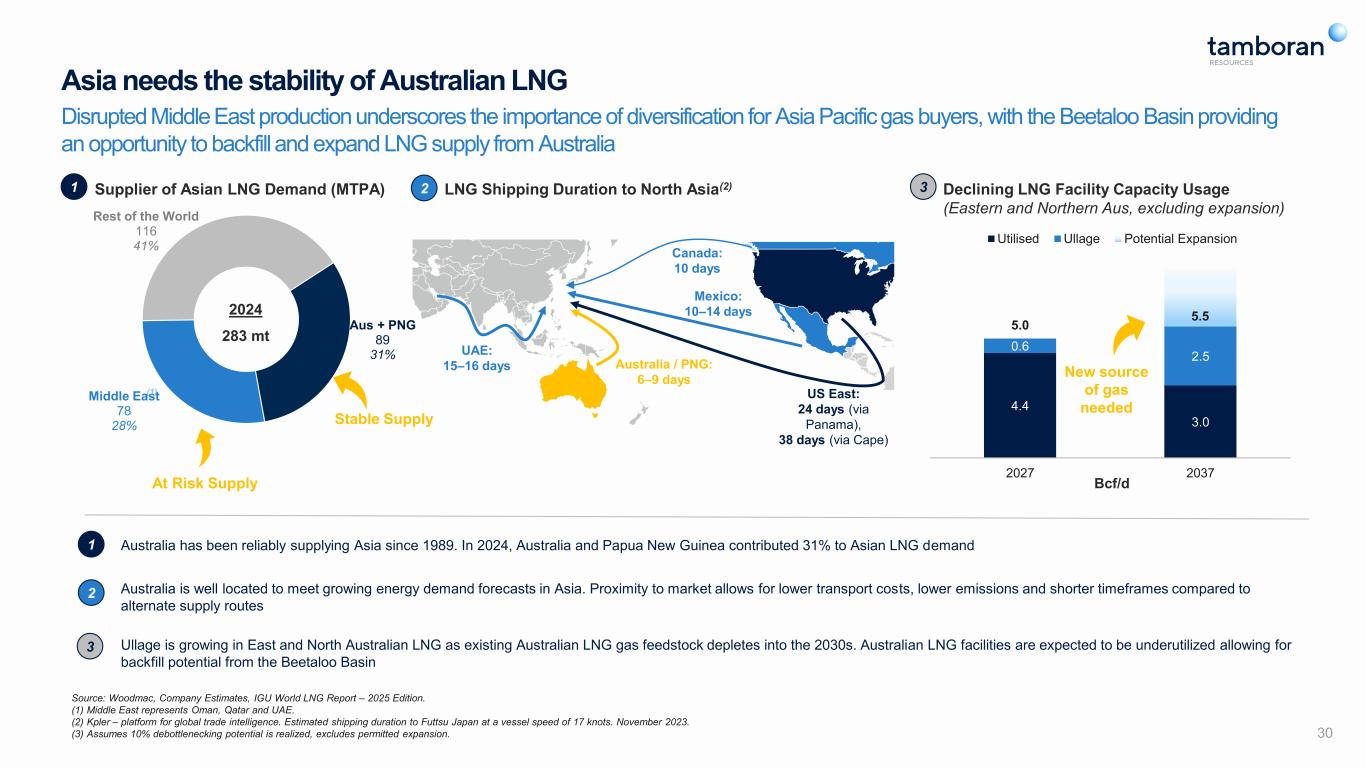
Aus + PNG 89 31% Middle East 78 28% Rest of the World 116 41% Asia needs the stability of Australian LNG Disrupted Middle East production underscores the importance of diversification for Asia Pacific gas buyers, with the Beetaloo Basin providing an opportunity to backfill and expand LNG supply from Australia Supplier of Asian LNG Demand (MTPA) 2024 283 mt UAE: 15–16 days Australia / PNG: 6–9 days US East: 24 days (via Panama), 38 days (via Cape) Mexico: 10–14 days Canada: 10 days LNG Shipping Duration to North Asia(2) Source: Woodmac, Company Estimates, IGU World LNG Report – 2025 Edition. (1) Middle East represents Oman, Qatar and UAE. (2) Kpler – platform for global trade intelligence. Estimated shipping duration to Futtsu Japan at a vessel speed of 17 knots. November 2023. (3) Assumes 10% debottlenecking potential is realized, excludes permitted expansion. Declining LNG Facility Capacity Usage (Eastern and Northern Aus, excluding expansion) (3) 1 32 1 3 2 Australia has been reliably supplying Asia since 1989. In 2024, Australia and Papua New Guinea contributed 31% to Asian LNG demand Australia is well located to meet growing energy demand forecasts in Asia. Proximity to market allows for lower transport costs, lower emissions and shorter timeframes compared to alternate supply routes Ullage is growing in East and North Australian LNG as existing Australian LNG gas feedstock depletes into the 2030s. Australian LNG facilities are expected to be underutilized allowing for backfill potential from the Beetaloo Basin At Risk Supply Stable Supply Bcf/d New source of gas needed (1) 4.4 3.0 0.6 2.5 5.0 5.5 2027 2037 Utilised Ullage Potential Expansion 30
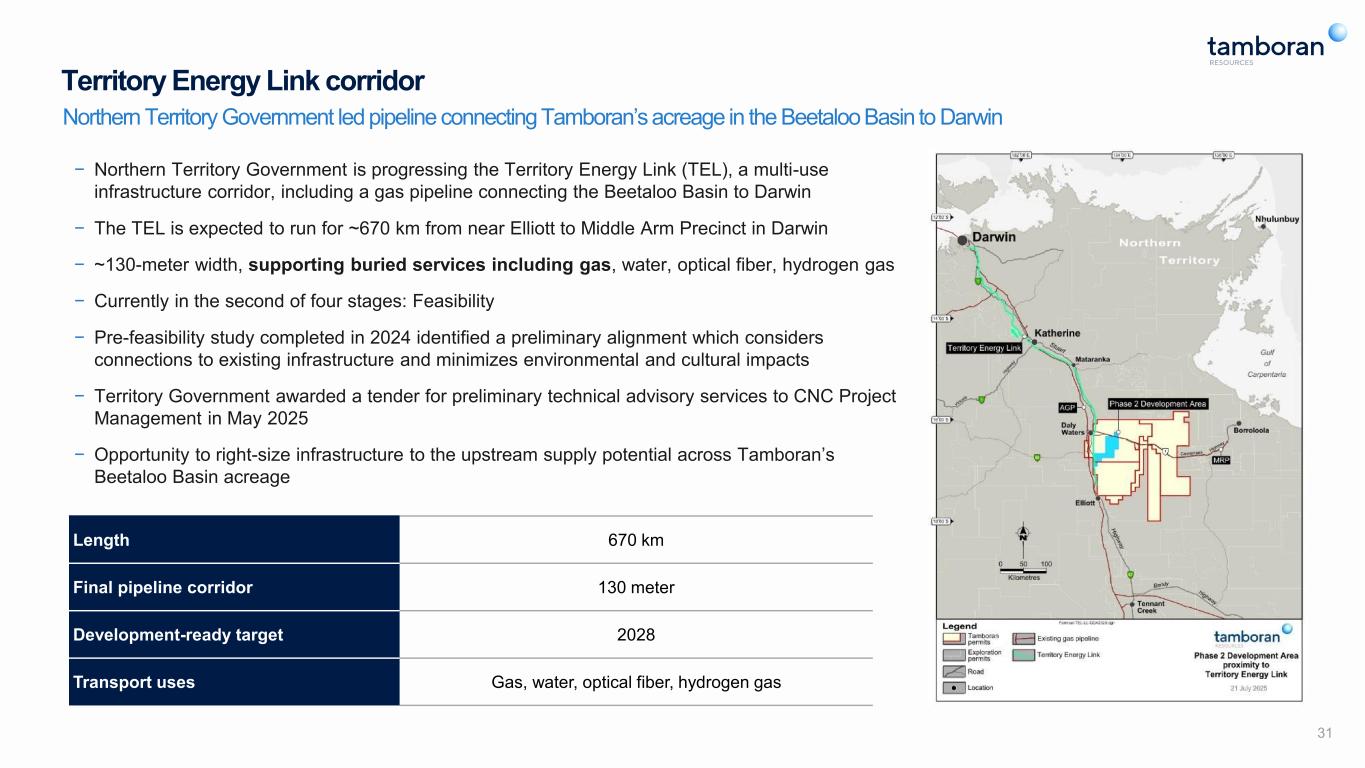
31 Territory Energy Link corridor Northern Territory Government led pipeline connecting Tamboran’s acreage in the Beetaloo Basin to Darwin − Northern Territory Government is progressing the Territory Energy Link (TEL), a multi-use infrastructure corridor, including a gas pipeline connecting the Beetaloo Basin to Darwin − The TEL is expected to run for ~670 km from near Elliott to Middle Arm Precinct in Darwin − ~130-meter width, supporting buried services including gas, water, optical fiber, hydrogen gas − Currently in the second of four stages: Feasibility − Pre-feasibility study completed in 2024 identified a preliminary alignment which considers connections to existing infrastructure and minimizes environmental and cultural impacts − Territory Government awarded a tender for preliminary technical advisory services to CNC Project Management in May 2025 − Opportunity to right-size infrastructure to the upstream supply potential across Tamboran’s Beetaloo Basin acreage Length 670 km Final pipeline corridor 130 meter Development-ready target 2028 Transport uses Gas, water, optical fiber, hydrogen gas
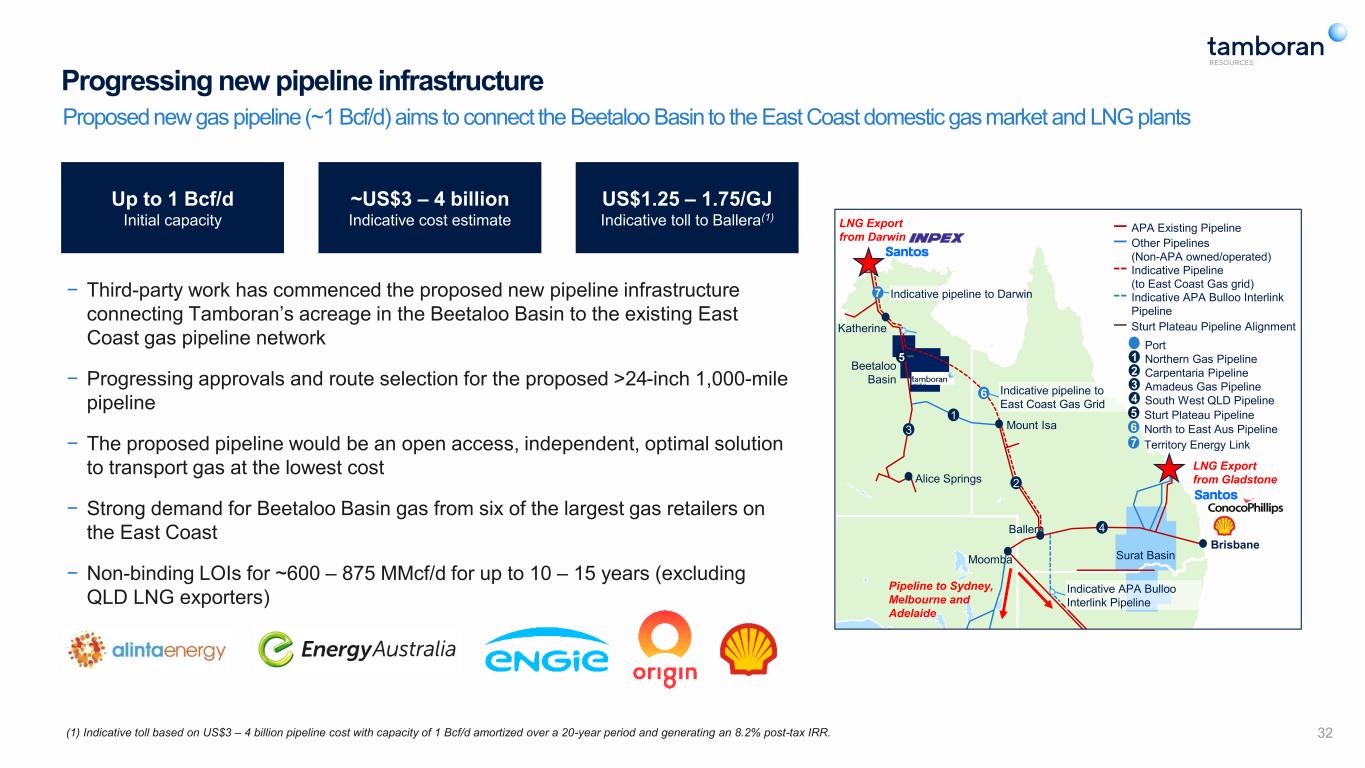
32 Progressing new pipeline infrastructure Proposed new gas pipeline (~1 Bcf/d) aims to connect the Beetaloo Basin to the East Coast domestic gas market and LNG plants − Third-party work has commenced the proposed new pipeline infrastructure connecting Tamboran’s acreage in the Beetaloo Basin to the existing East Coast gas pipeline network − Progressing approvals and route selection for the proposed >24-inch 1,000-mile pipeline − The proposed pipeline would be an open access, independent, optimal solution to transport gas at the lowest cost − Strong demand for Beetaloo Basin gas from six of the largest gas retailers on the East Coast − Non-binding LOIs for ~600 – 875 MMcf/d for up to 10 – 15 years (excluding QLD LNG exporters) (1) Indicative toll based on US$3 – 4 billion pipeline cost with capacity of 1 Bcf/d amortized over a 20-year period and generating an 8.2% post-tax IRR. 2 Katherine Mount Isa Brisbane Moomba Surat Basin Ballera 3 Beetaloo Basin 4 1 Port 1 Northern Gas Pipeline 2 Carpentaria Pipeline 3 Amadeus Gas Pipeline 4 South West QLD Pipeline APA Existing Pipeline Other Pipelines (Non-APA owned/operated) Indicative Pipeline (to East Coast Gas grid) Indicative APA Bulloo Interlink Pipeline Sturt Plateau Pipeline Alignment Indicative pipeline to Darwin Indicative pipeline to East Coast Gas Grid Indicative APA Bulloo Interlink Pipeline Alice Springs 5 Sturt Plateau Pipeline 6 North to East Aus Pipeline 6 5 7 7 Territory Energy Link LNG Export from Darwin LNG Export from Gladstone Pipeline to Sydney, Melbourne and Adelaide Up to 1 Bcf/d Initial capacity ~US$3 – 4 billion Indicative cost estimate US$1.25 – 1.75/GJ Indicative toll to Ballera(1)
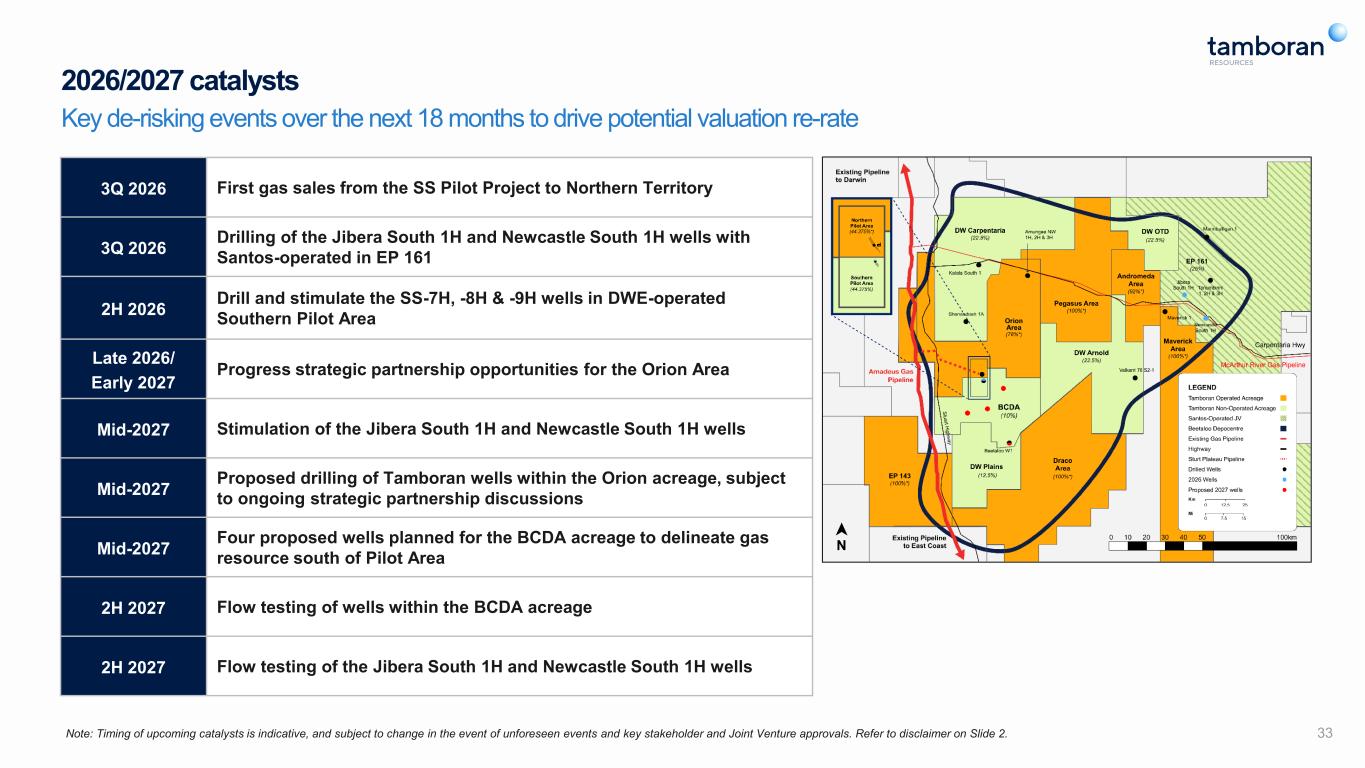
2026/2027 catalysts Key de-risking events over the next 18 months to drive potential valuation re-rate Note: Timing of upcoming catalysts is indicative, and subject to change in the event of unforeseen events and key stakeholder and Joint Venture approvals. Refer to disclaimer on Slide 2. 3Q 2026 First gas sales from the SS Pilot Project to Northern Territory 3Q 2026 Drilling of the Jibera South 1H and Newcastle South 1H wells with Santos-operated in EP 161 2H 2026 Drill and stimulate the SS-7H, -8H & -9H wells in DWE-operated Southern Pilot Area Late 2026/ Early 2027 Progress strategic partnership opportunities for the Orion Area Mid-2027 Stimulation of the Jibera South 1H and Newcastle South 1H wells Mid-2027 Proposed drilling of Tamboran wells within the Orion acreage, subject to ongoing strategic partnership discussions Mid-2027 Four proposed wells planned for the BCDA acreage to delineate gas resource south of Pilot Area 2H 2027 Flow testing of wells within the BCDA acreage 2H 2027 Flow testing of the Jibera South 1H and Newcastle South 1H wells 33

Appendix
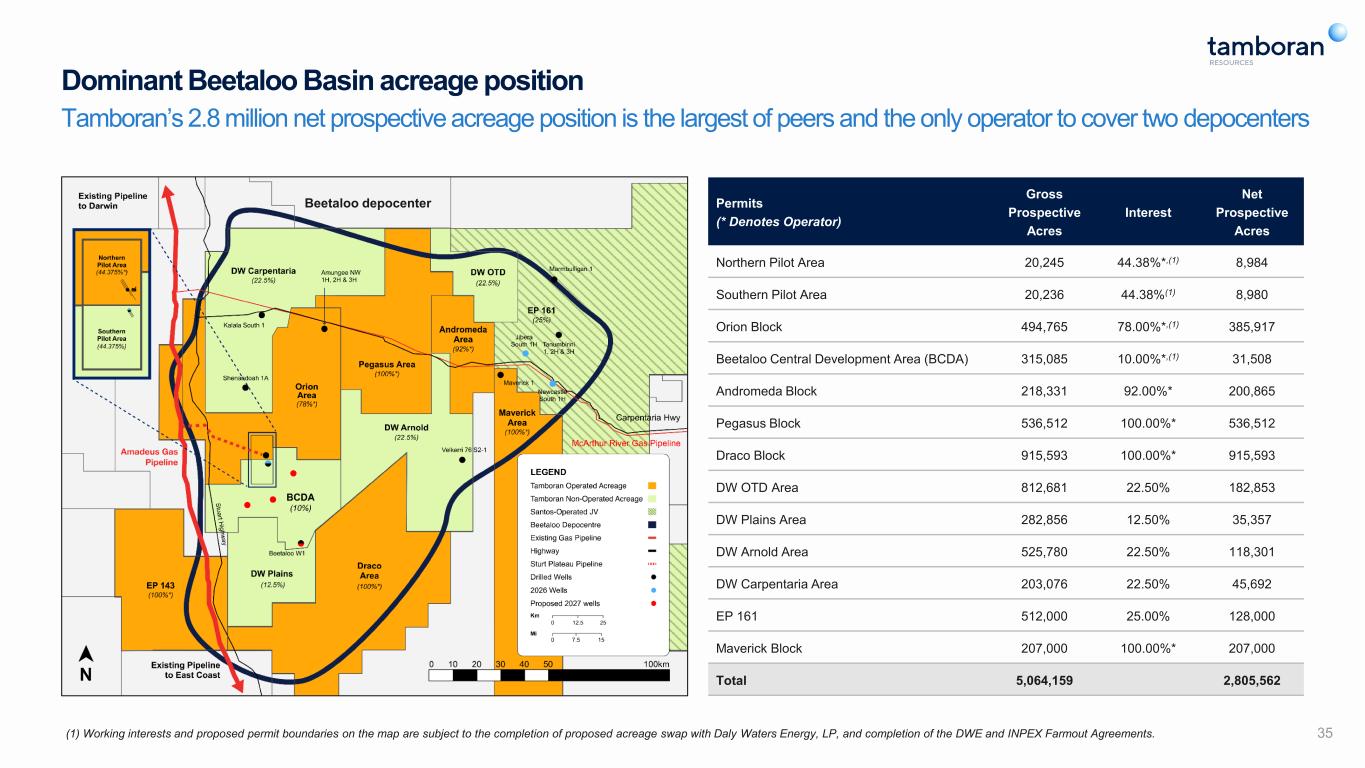
35 Dominant Beetaloo Basin acreage position Tamboran’s 2.8 million net prospective acreage position is the largest of peers and the only operator to cover two depocenters Permits (* Denotes Operator) Gross Prospective Acres Interest Net Prospective Acres Northern Pilot Area 20,245 44.38%*,(1) 8,984 Southern Pilot Area 20,236 44.38%(1) 8,980 Orion Block 494,765 78.00%*,(1) 385,917 Beetaloo Central Development Area (BCDA) 315,085 10.00%*,(1) 31,508 Andromeda Block 218,331 92.00%* 200,865 Pegasus Block 536,512 100.00%* 536,512 Draco Block 915,593 100.00%* 915,593 DW OTD Area 812,681 22.50% 182,853 DW Plains Area 282,856 12.50% 35,357 DW Arnold Area 525,780 22.50% 118,301 DW Carpentaria Area 203,076 22.50% 45,692 EP 161 512,000 25.00% 128,000 Maverick Block 207,000 100.00%* 207,000 Total 5,064,159 2,805,562 Beetaloo depocenter (1) Working interests and proposed permit boundaries on the map are subject to the completion of proposed acreage swap with Daly Waters Energy, LP, and completion of the DWE and INPEX Farmout Agreements.
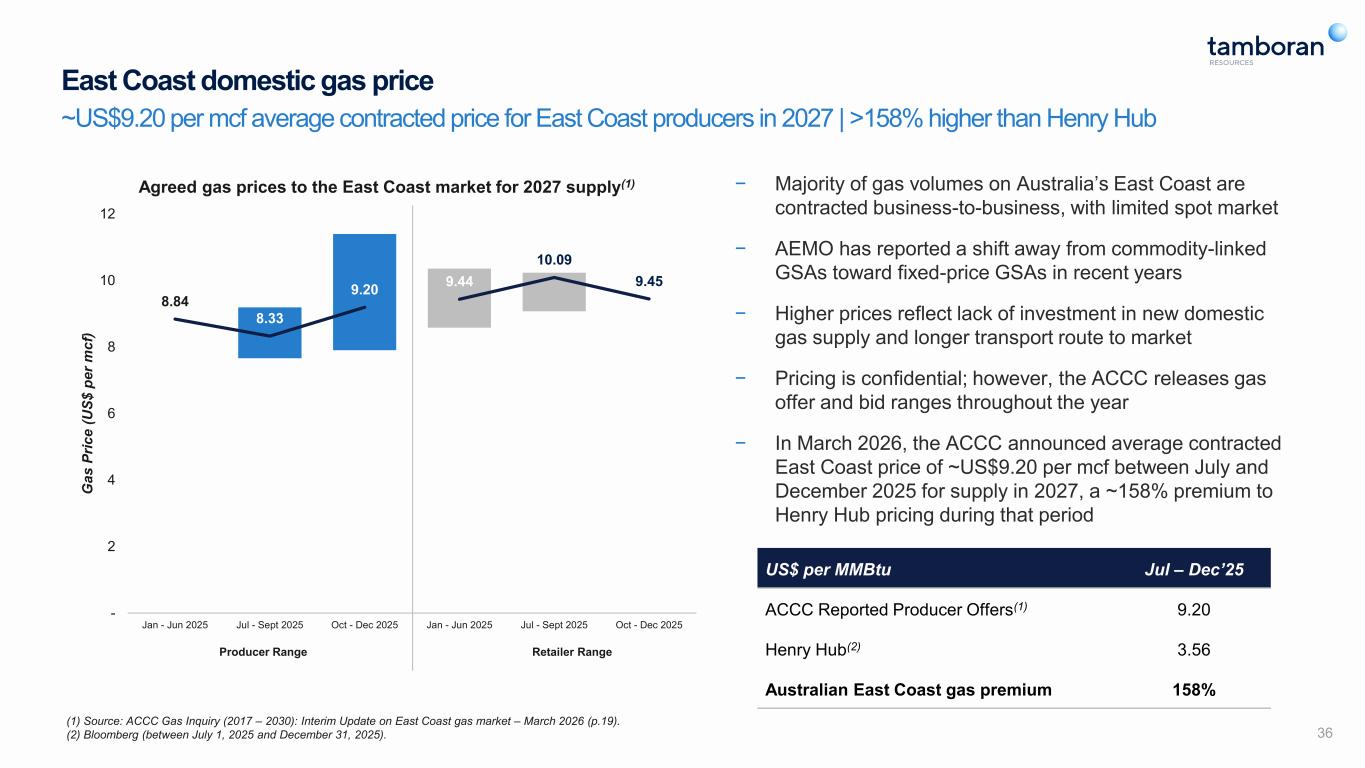
East Coast domestic gas price ~US$9.20 per mcf average contracted price for East Coast producers in 2027 | >158% higher than Henry Hub − Majority of gas volumes on Australia’s East Coast are contracted business-to-business, with limited spot market − AEMO has reported a shift away from commodity-linked GSAs toward fixed-price GSAs in recent years − Higher prices reflect lack of investment in new domestic gas supply and longer transport route to market − Pricing is confidential; however, the ACCC releases gas offer and bid ranges throughout the year − In March 2026, the ACCC announced average contracted East Coast price of ~US$9.20 per mcf between July and December 2025 for supply in 2027, a ~158% premium to Henry Hub pricing during that period 8.84 8.33 9.20 9.44 10.09 9.45 - 2 4 6 8 10 12 Jan - Jun 2025 Jul - Sept 2025 Oct - Dec 2025 Jan - Jun 2025 Jul - Sept 2025 Oct - Dec 2025 G a s P ri c e ( U S $ p e r m c f) Agreed gas prices to the East Coast market for 2027 supply(1) Producer Range Retailer Range US$ per MMBtu Jul – Dec’25 ACCC Reported Producer Offers(1) 9.20 Henry Hub(2) 3.56 Australian East Coast gas premium 158% (1) Source: ACCC Gas Inquiry (2017 – 2030): Interim Update on East Coast gas market – March 2026 (p.19). (2) Bloomberg (between July 1, 2025 and December 31, 2025). 36
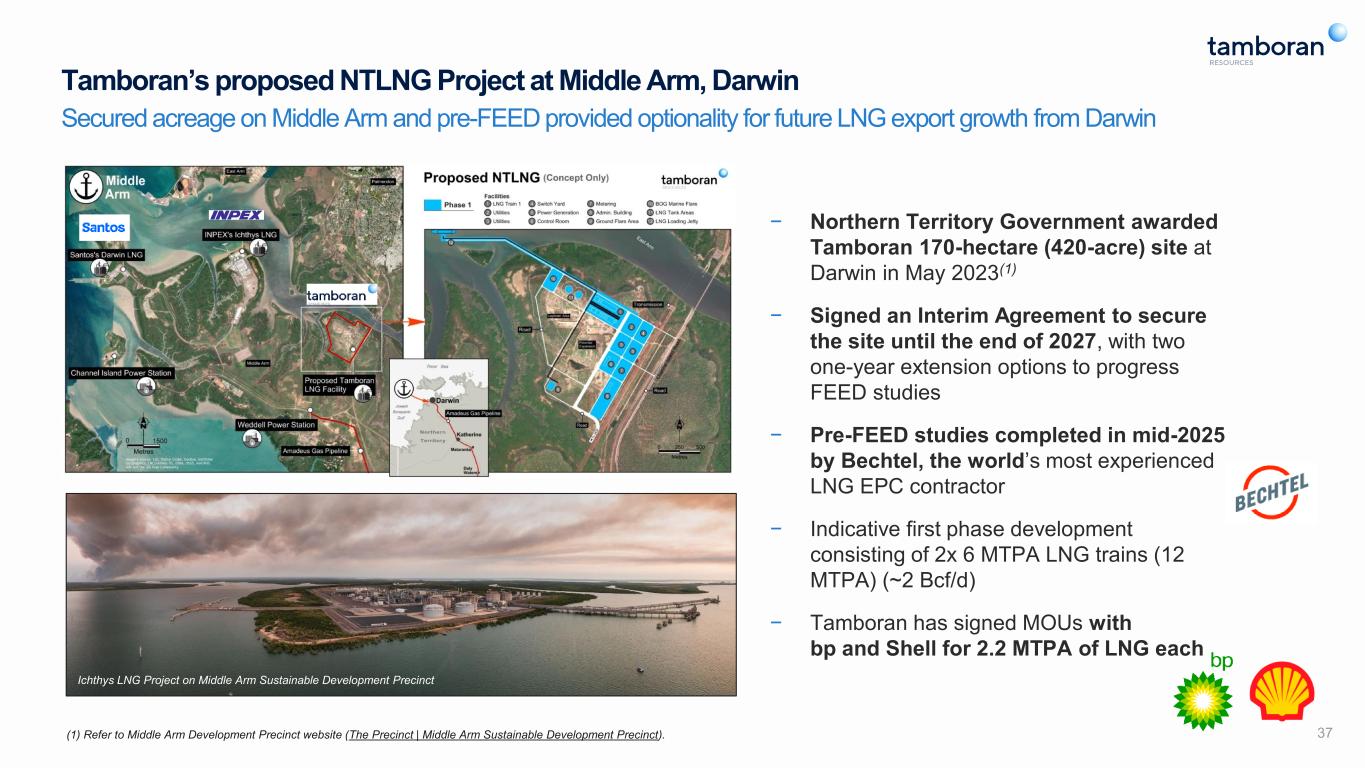
− Northern Territory Government awarded Tamboran 170-hectare (420-acre) site at Darwin in May 2023(1) − Signed an Interim Agreement to secure the site until the end of 2027, with two one-year extension options to progress FEED studies − Pre-FEED studies completed in mid-2025 by Bechtel, the world’s most experienced LNG EPC contractor − Indicative first phase development consisting of 2x 6 MTPA LNG trains (12 MTPA) (~2 Bcf/d) − Tamboran has signed MOUs with bp and Shell for 2.2 MTPA of LNG each (1) Refer to Middle Arm Development Precinct website (The Precinct | Middle Arm Sustainable Development Precinct). Secured acreage on Middle Arm and pre-FEED provided optionality for future LNG export growth from Darwin Tamboran’s proposed NTLNG Project at Middle Arm, Darwin Ichthys LNG Project on Middle Arm Sustainable Development Precinct 37
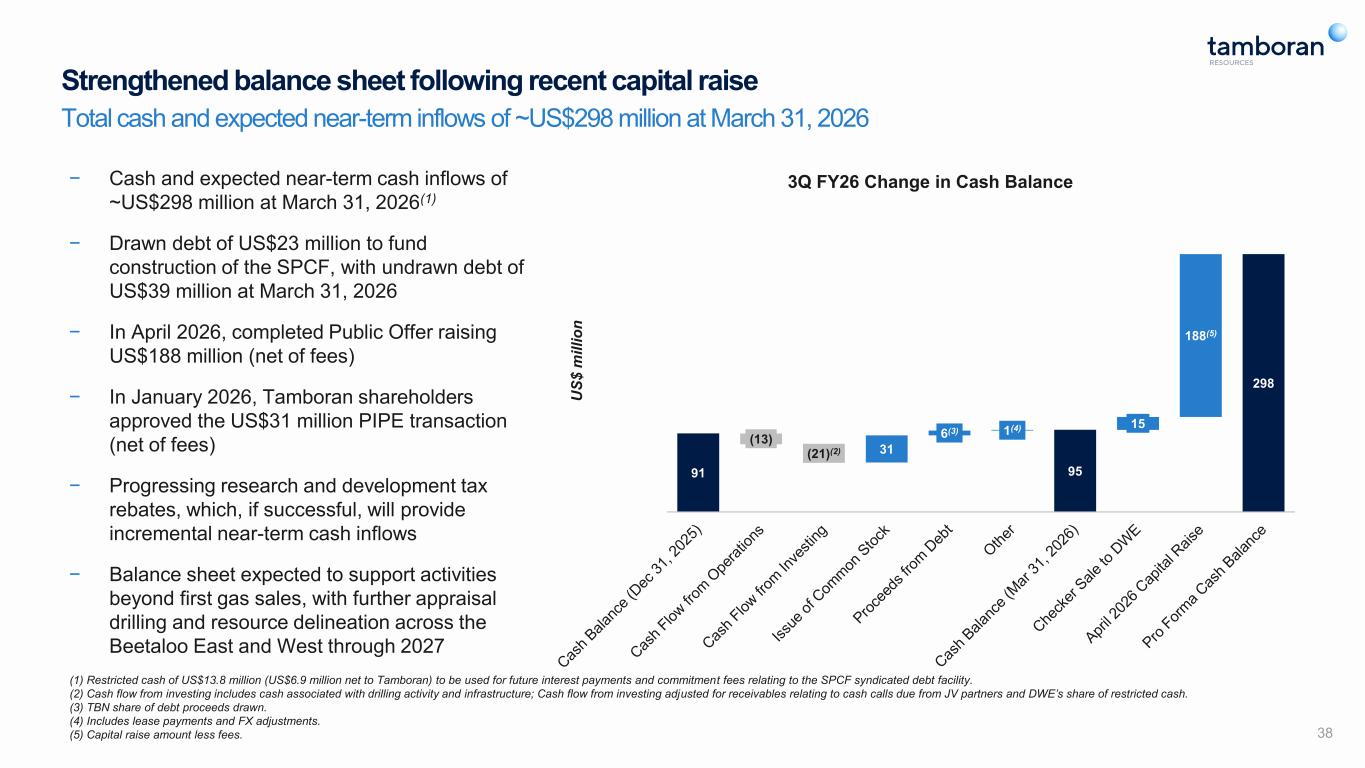
95 298 (13) (21)(2) 91 31 6(3) 1(4) 15 188(5) U S $ m il li o n 3Q FY26 Change in Cash Balance Strengthened balance sheet following recent capital raise (1) Restricted cash of US$13.8 million (US$6.9 million net to Tamboran) to be used for future interest payments and commitment fees relating to the SPCF syndicated debt facility. (2) Cash flow from investing includes cash associated with drilling activity and infrastructure; Cash flow from investing adjusted for receivables relating to cash calls due from JV partners and DWE’s share of restricted cash. (3) TBN share of debt proceeds drawn. (4) Includes lease payments and FX adjustments. (5) Capital raise amount less fees. Total cash and expected near-term inflows of ~US$298 million at March 31, 2026 − Cash and expected near-term cash inflows of ~US$298 million at March 31, 2026(1) − Drawn debt of US$23 million to fund construction of the SPCF, with undrawn debt of US$39 million at March 31, 2026 − In April 2026, completed Public Offer raising US$188 million (net of fees) − In January 2026, Tamboran shareholders approved the US$31 million PIPE transaction (net of fees) − Progressing research and development tax rebates, which, if successful, will provide incremental near-term cash inflows − Balance sheet expected to support activities beyond first gas sales, with further appraisal drilling and resource delineation across the Beetaloo East and West through 2027 38